EinoDev visual debug plugin guide
Introduction
💡 Using this plugin, you can visually debug the orchestration products (Graph, Chain) written using the Eino framework:
- Visualization rendering of orchestration products;
- Debug by mocking inputs starting from any operational node.
Quick Start
Download eino-example
github repo:https://github.com/cloudwego/eino-examples
# HTTPS
git clone https://github.com/cloudwego/eino-examples.git

# SSH
git clone git@github.com:cloudwego/eino-examples.git
Install Dependencies
Execute the following commands in the project directory
# 1. Pull latest devops repository
go get github.com/cloudwego/eino-ext/devops@latest

# 2. Cleans and updates go.mod and go.sum
go mod tidy
Run Demo
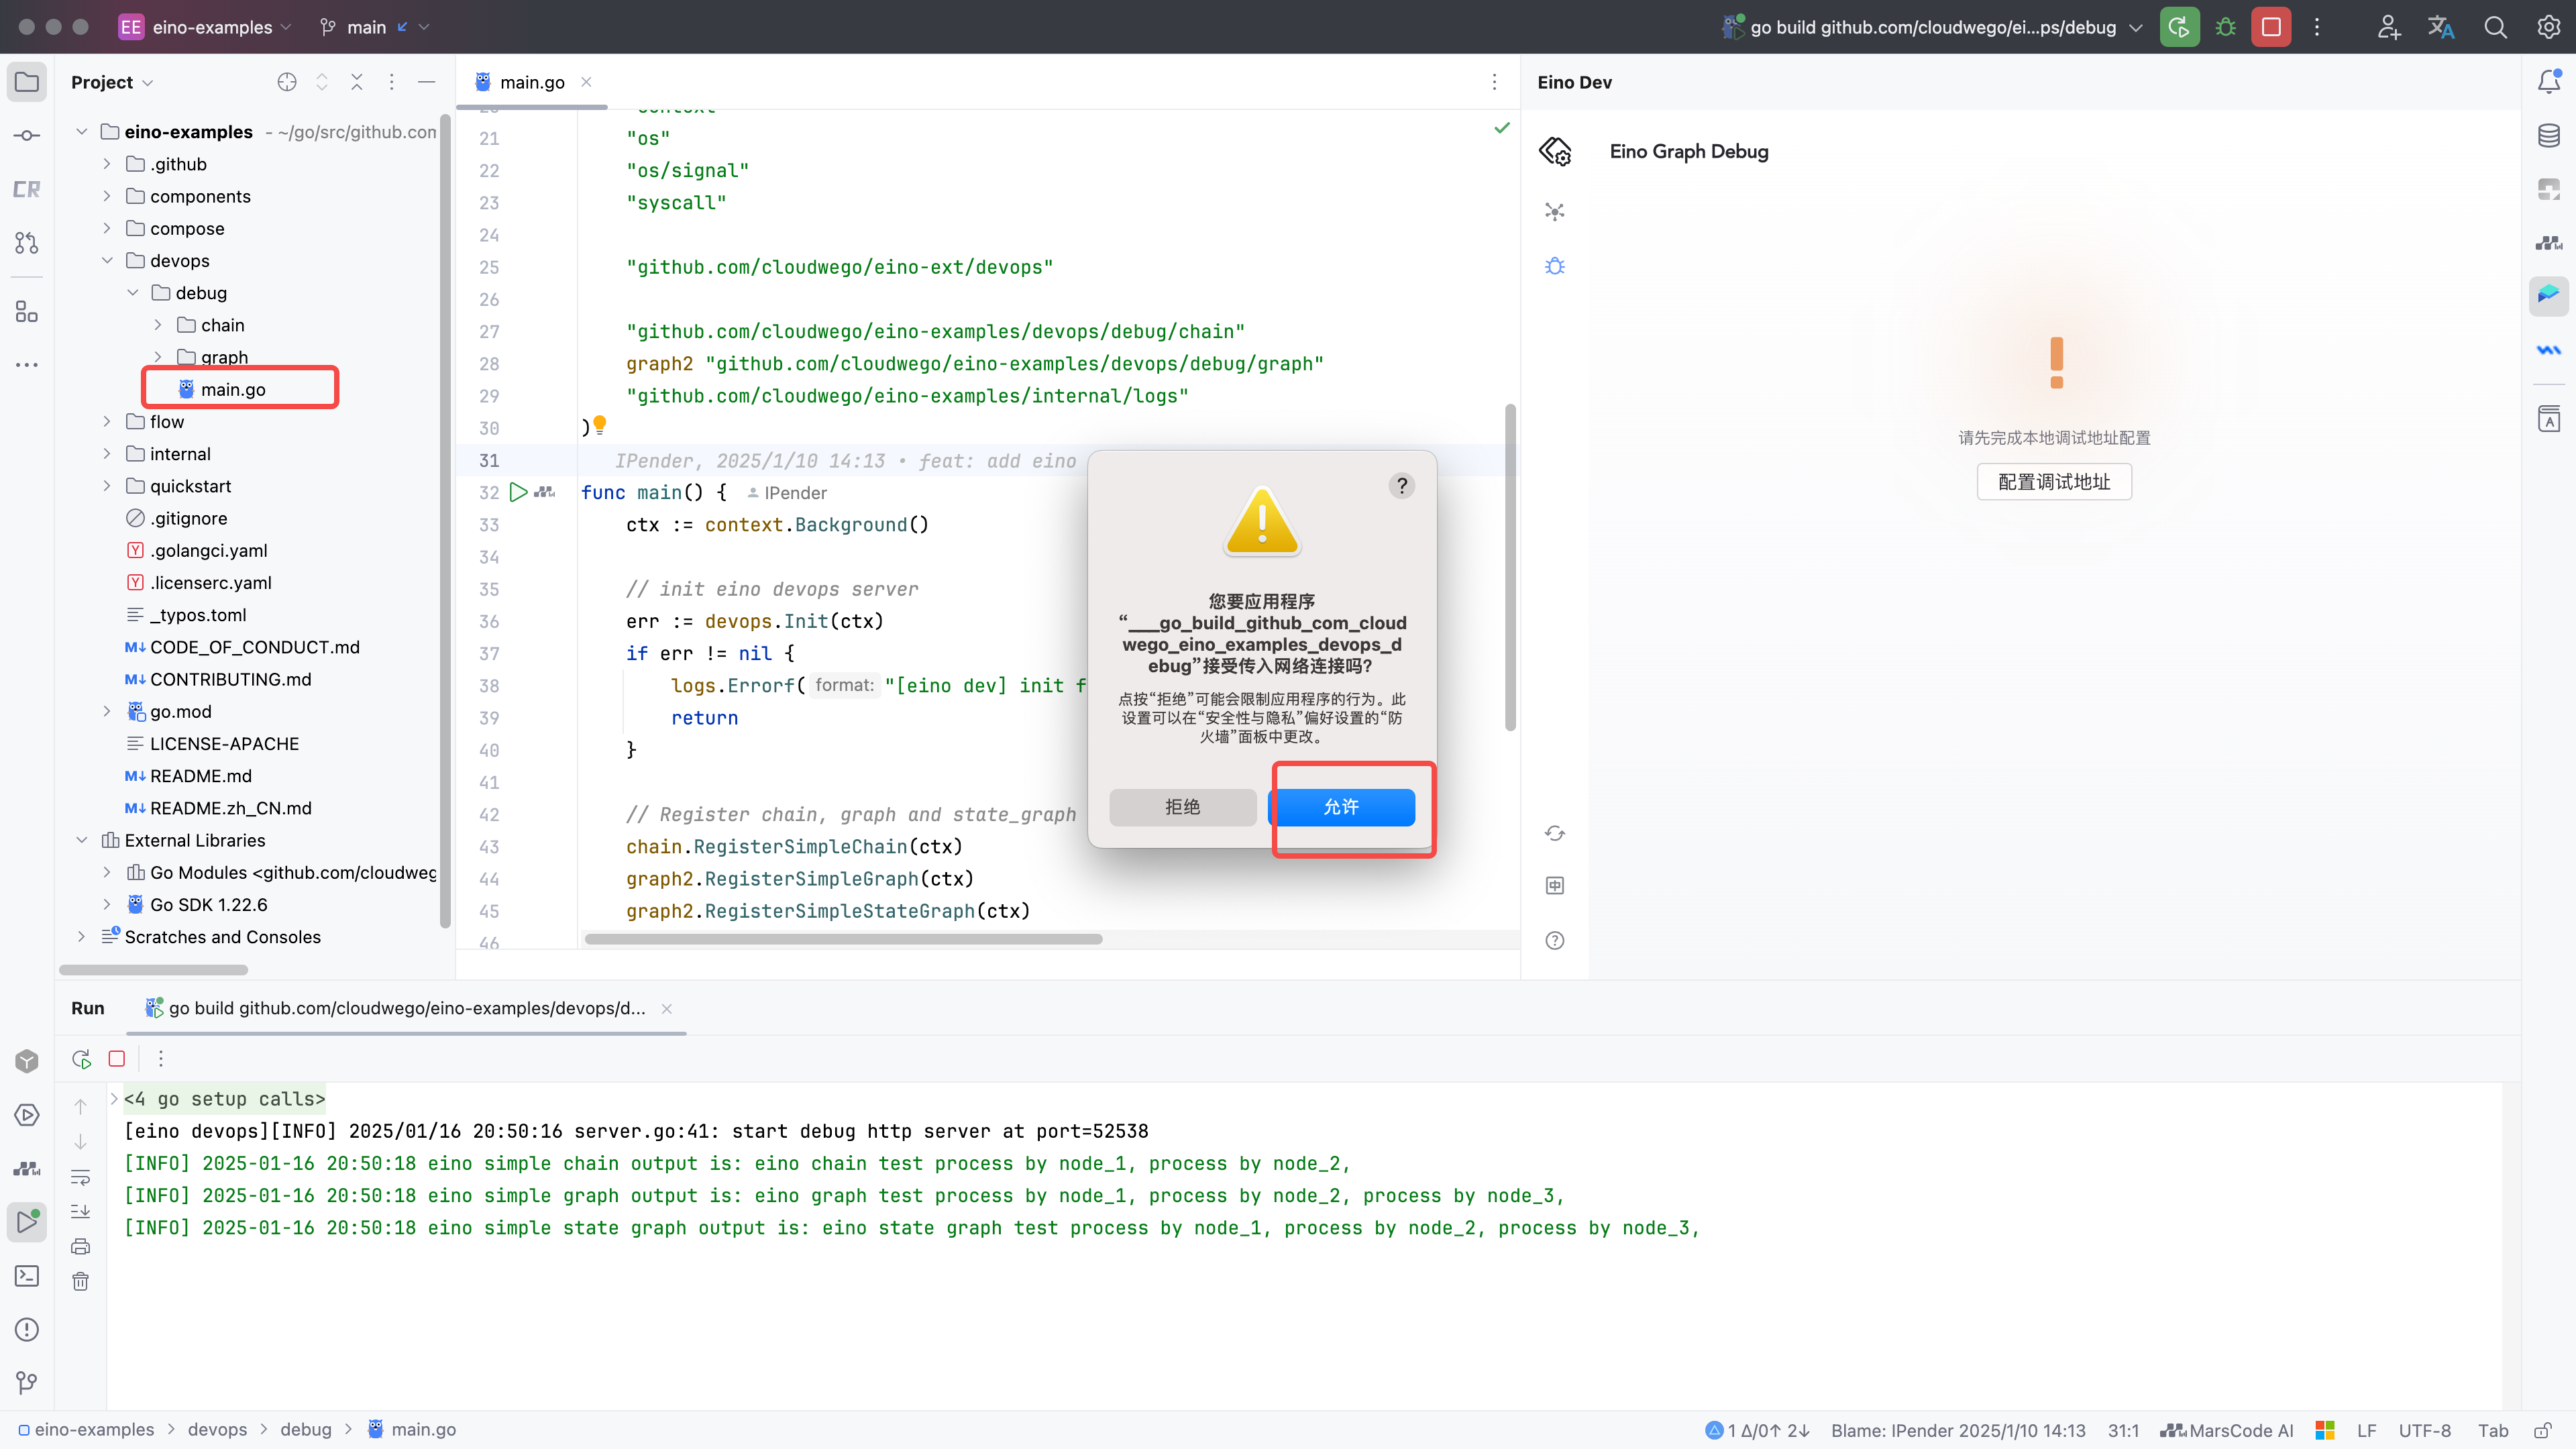
Go to eino-examples/devops/debug/main.go, and run main.go. Since the plugin will also start a local HTTP service to connect the user service process, a network connection warning will pop up. Click Allow.
Configure Debug Address
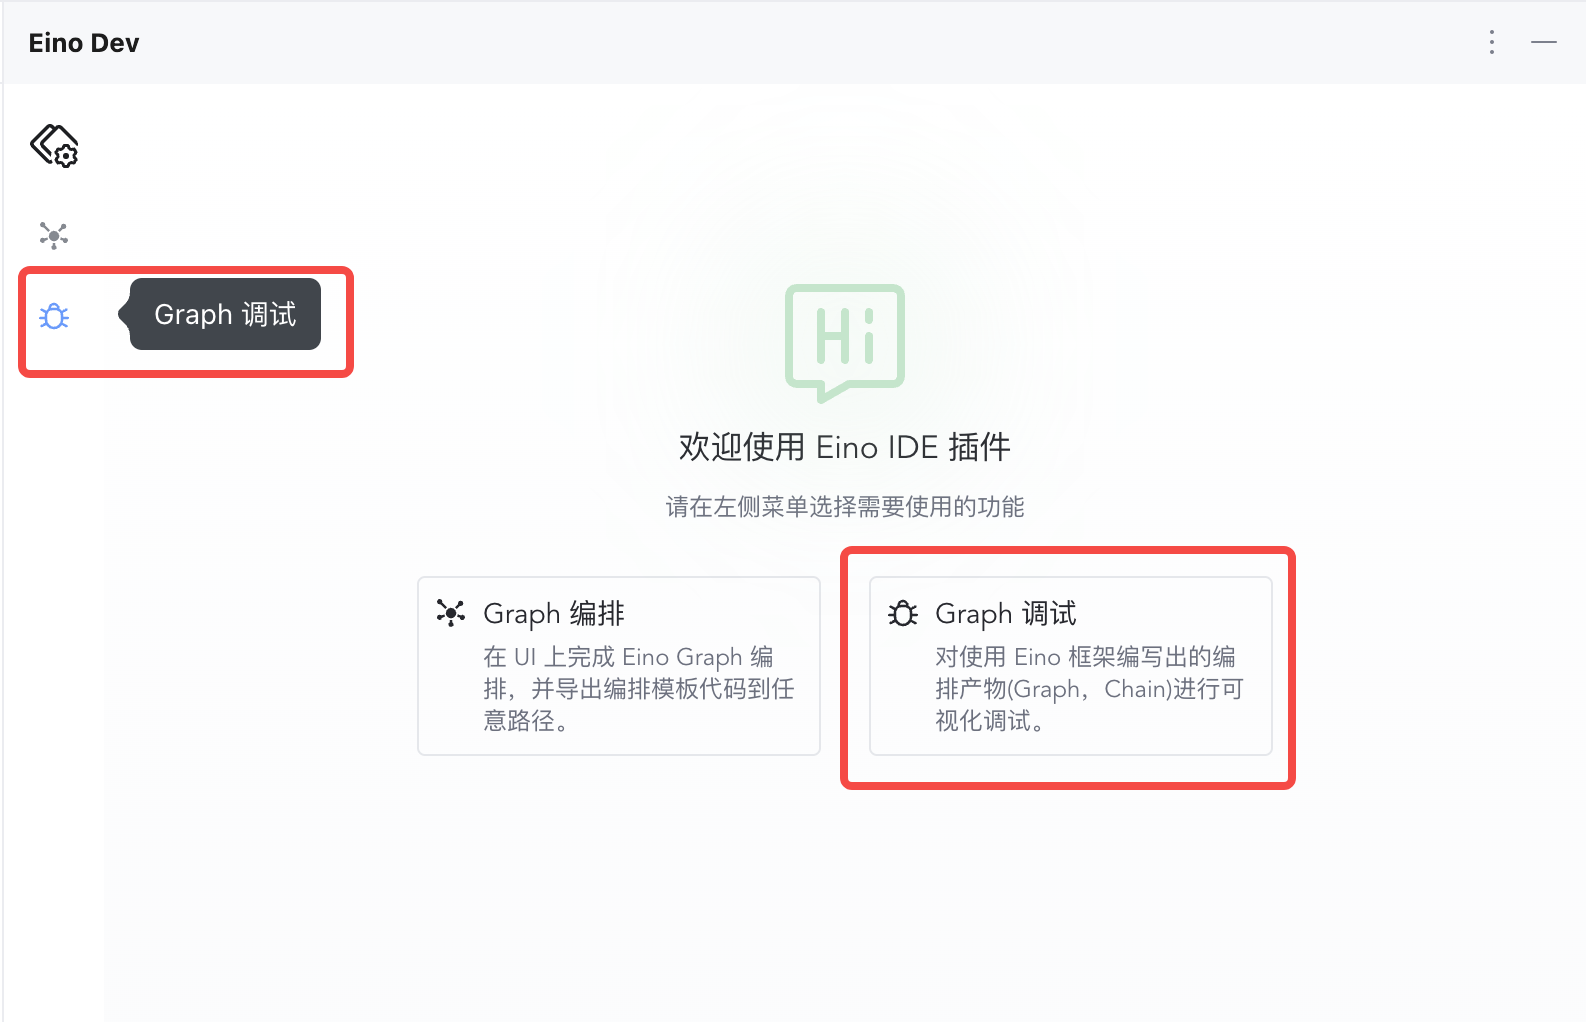
1.Click the debugging feature on the left or in the middle to enter the debugging configuration
|
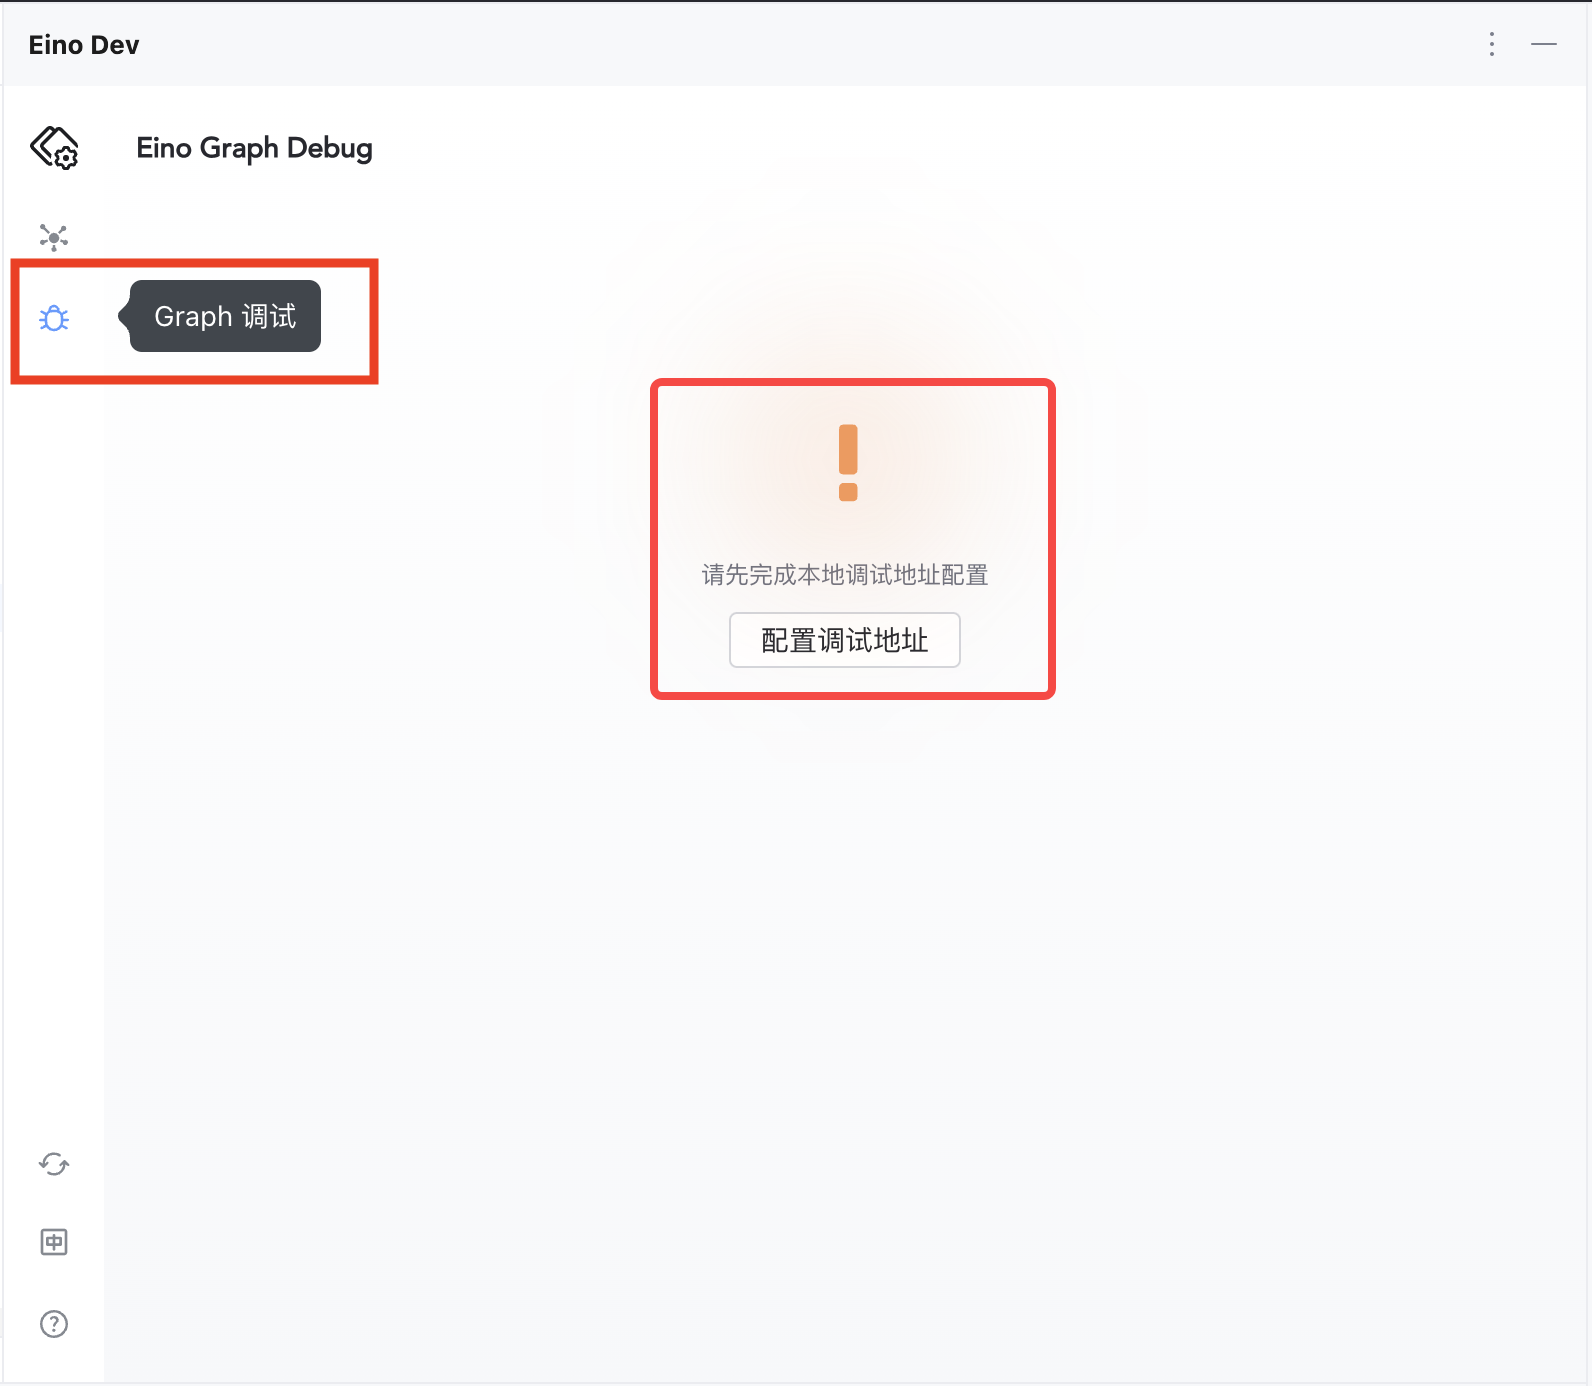
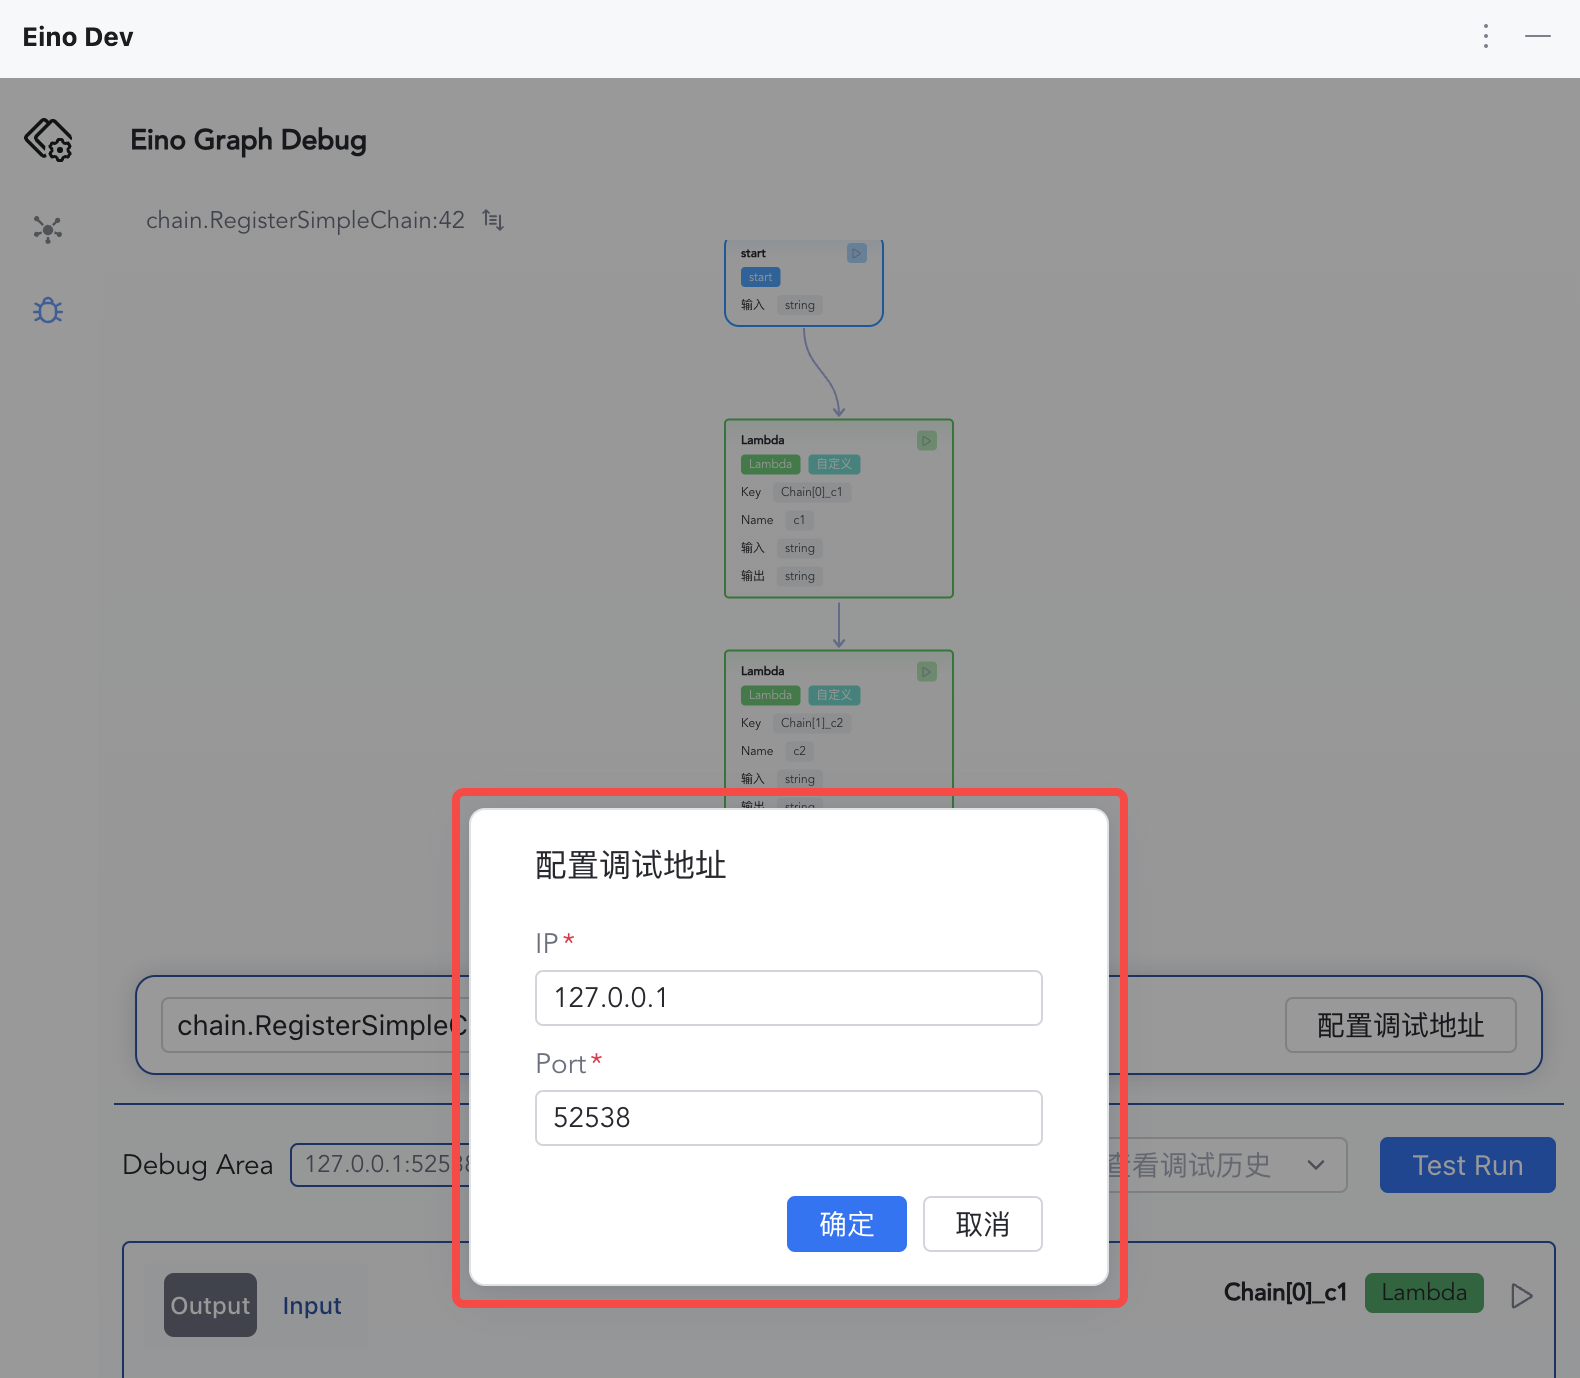
2.Click to configure the debug address
|
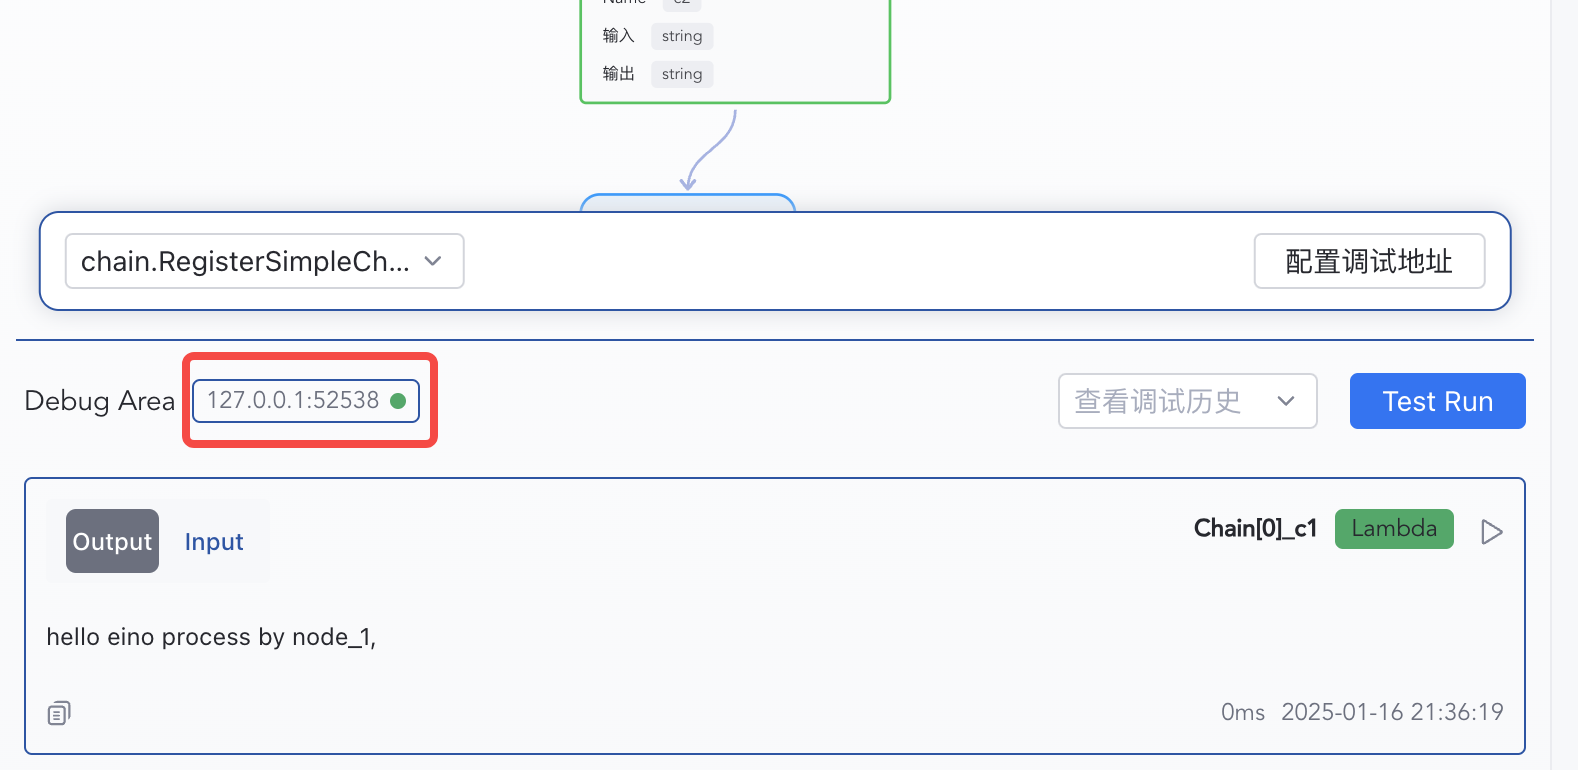
3.Enter 127.0.0.1:52538
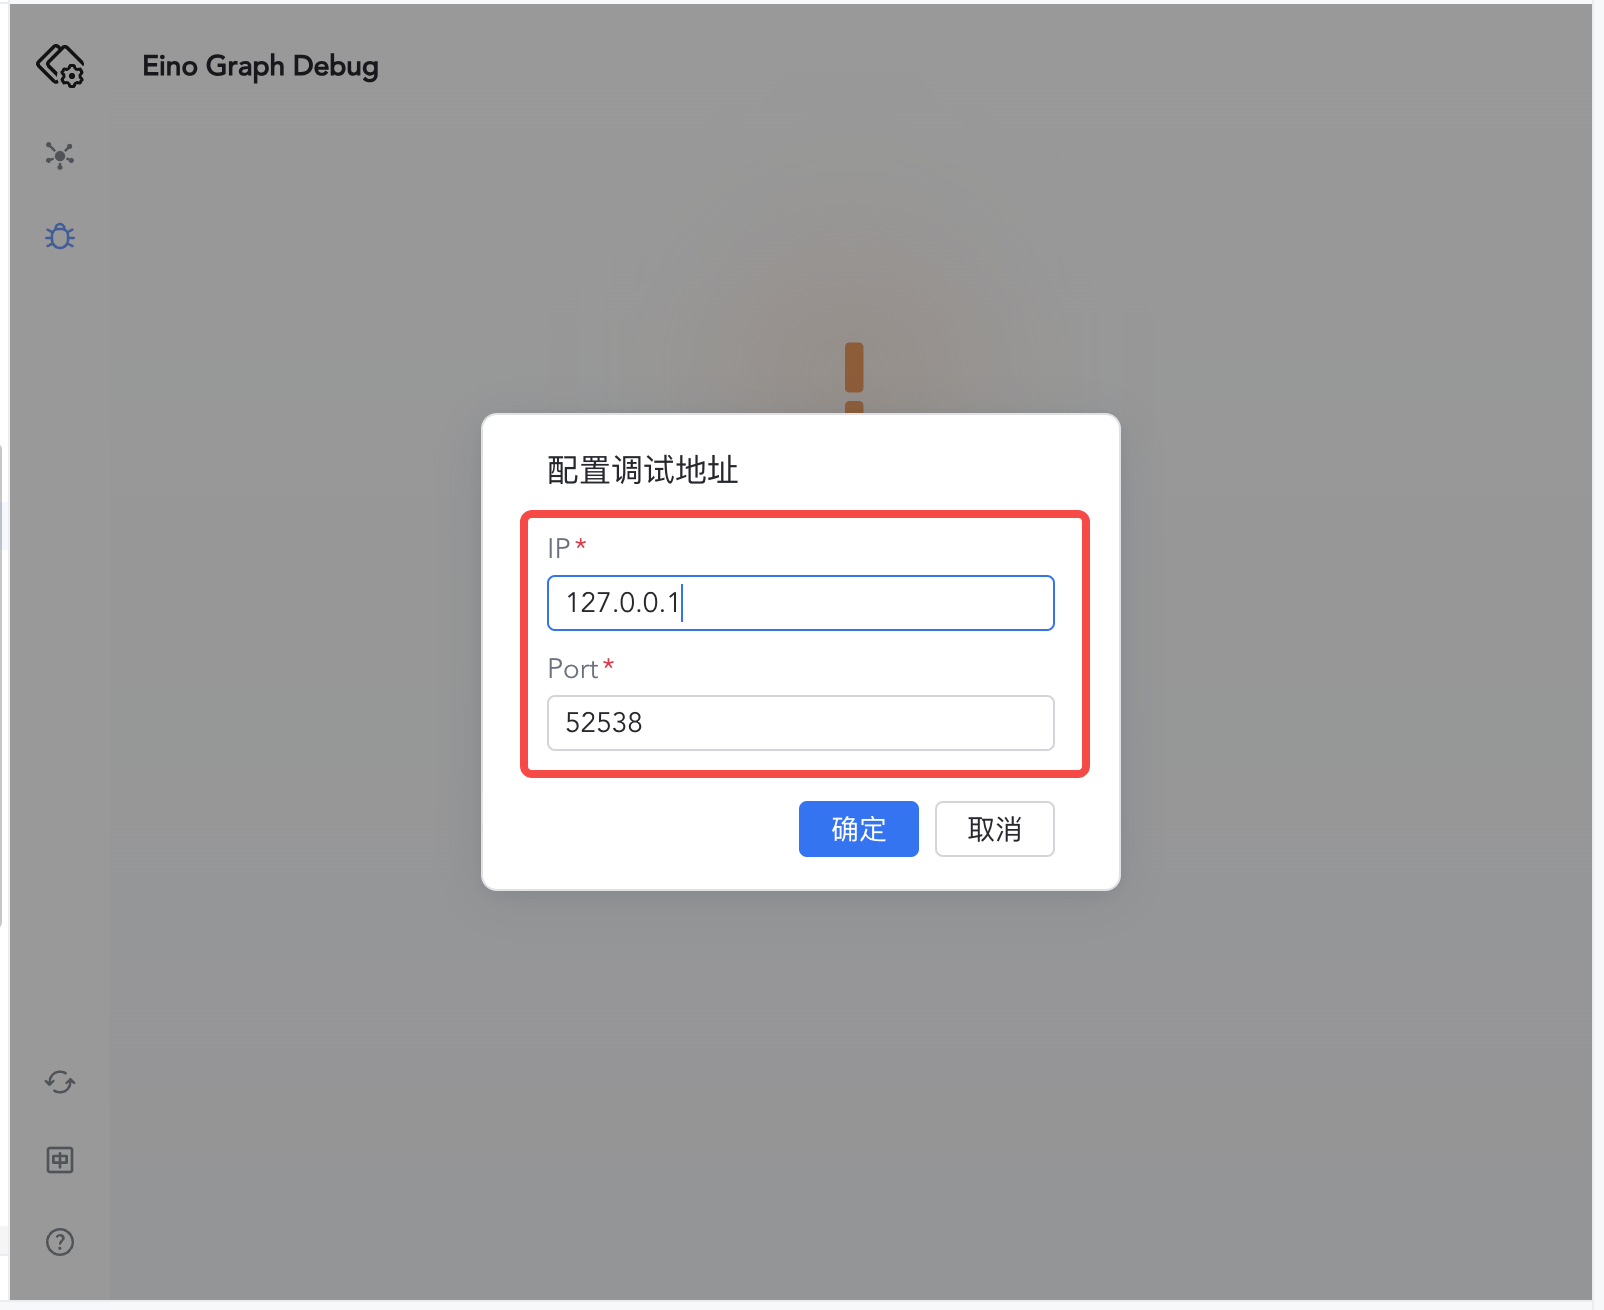
|
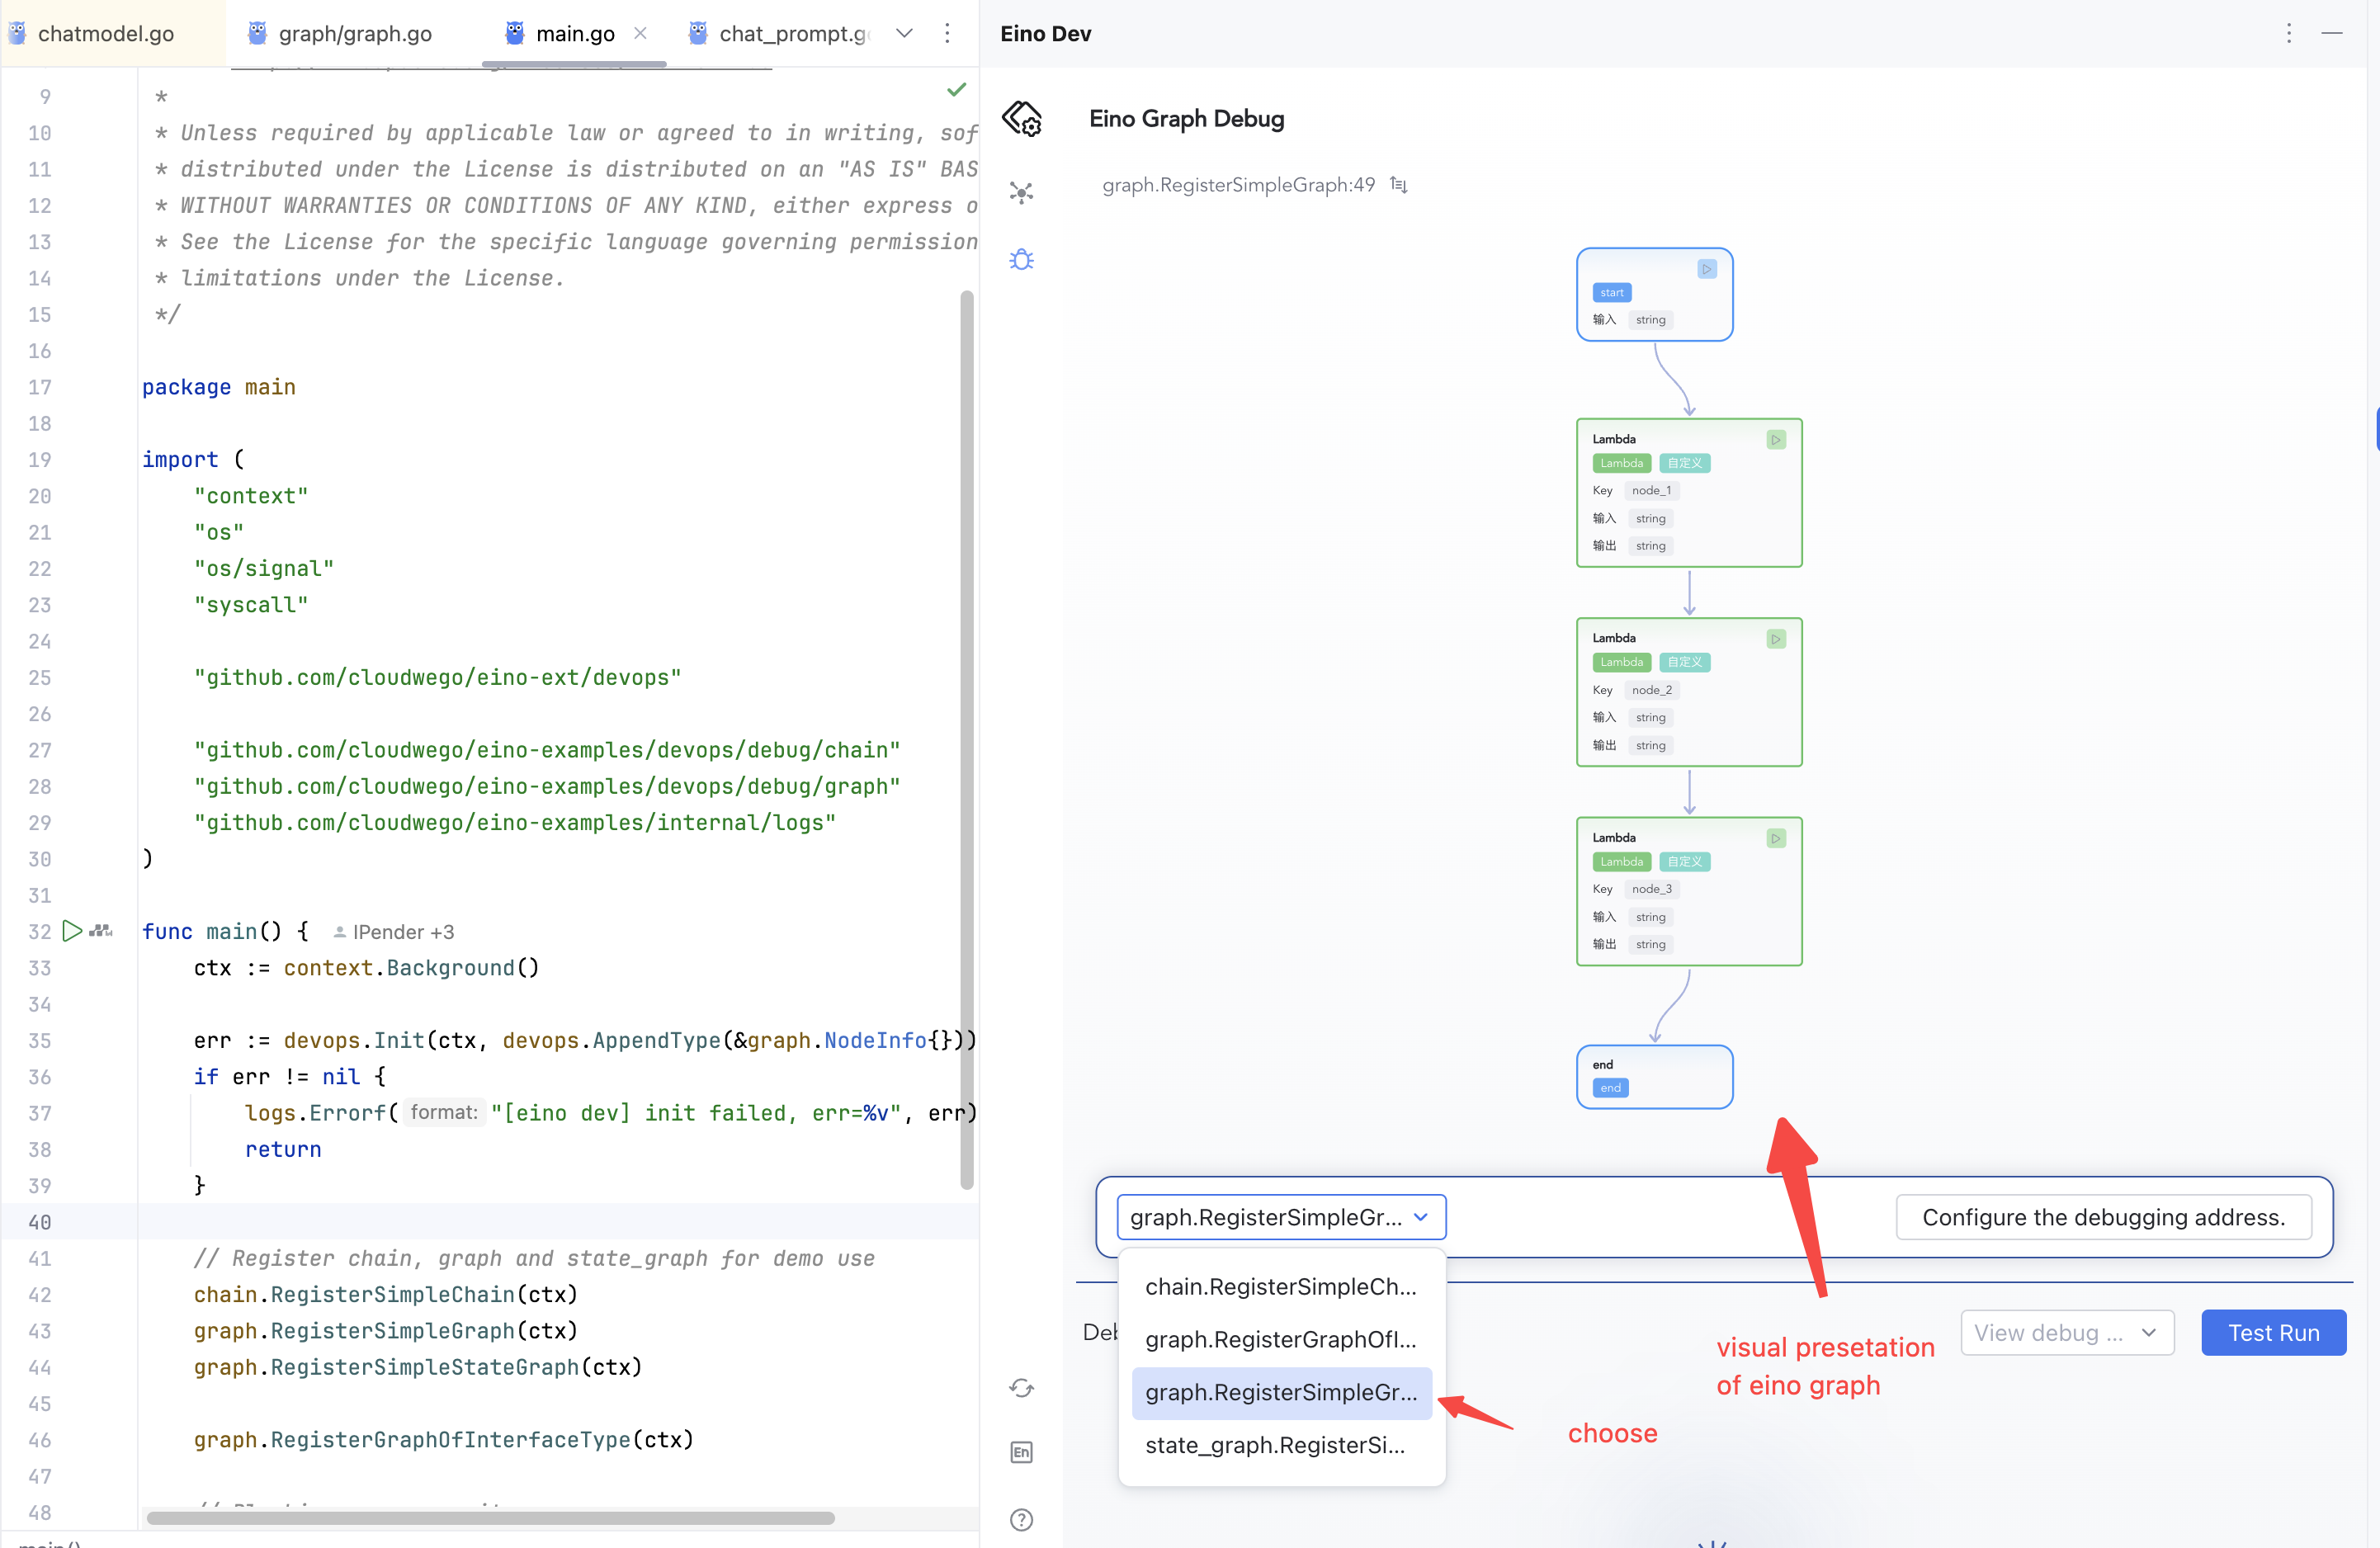
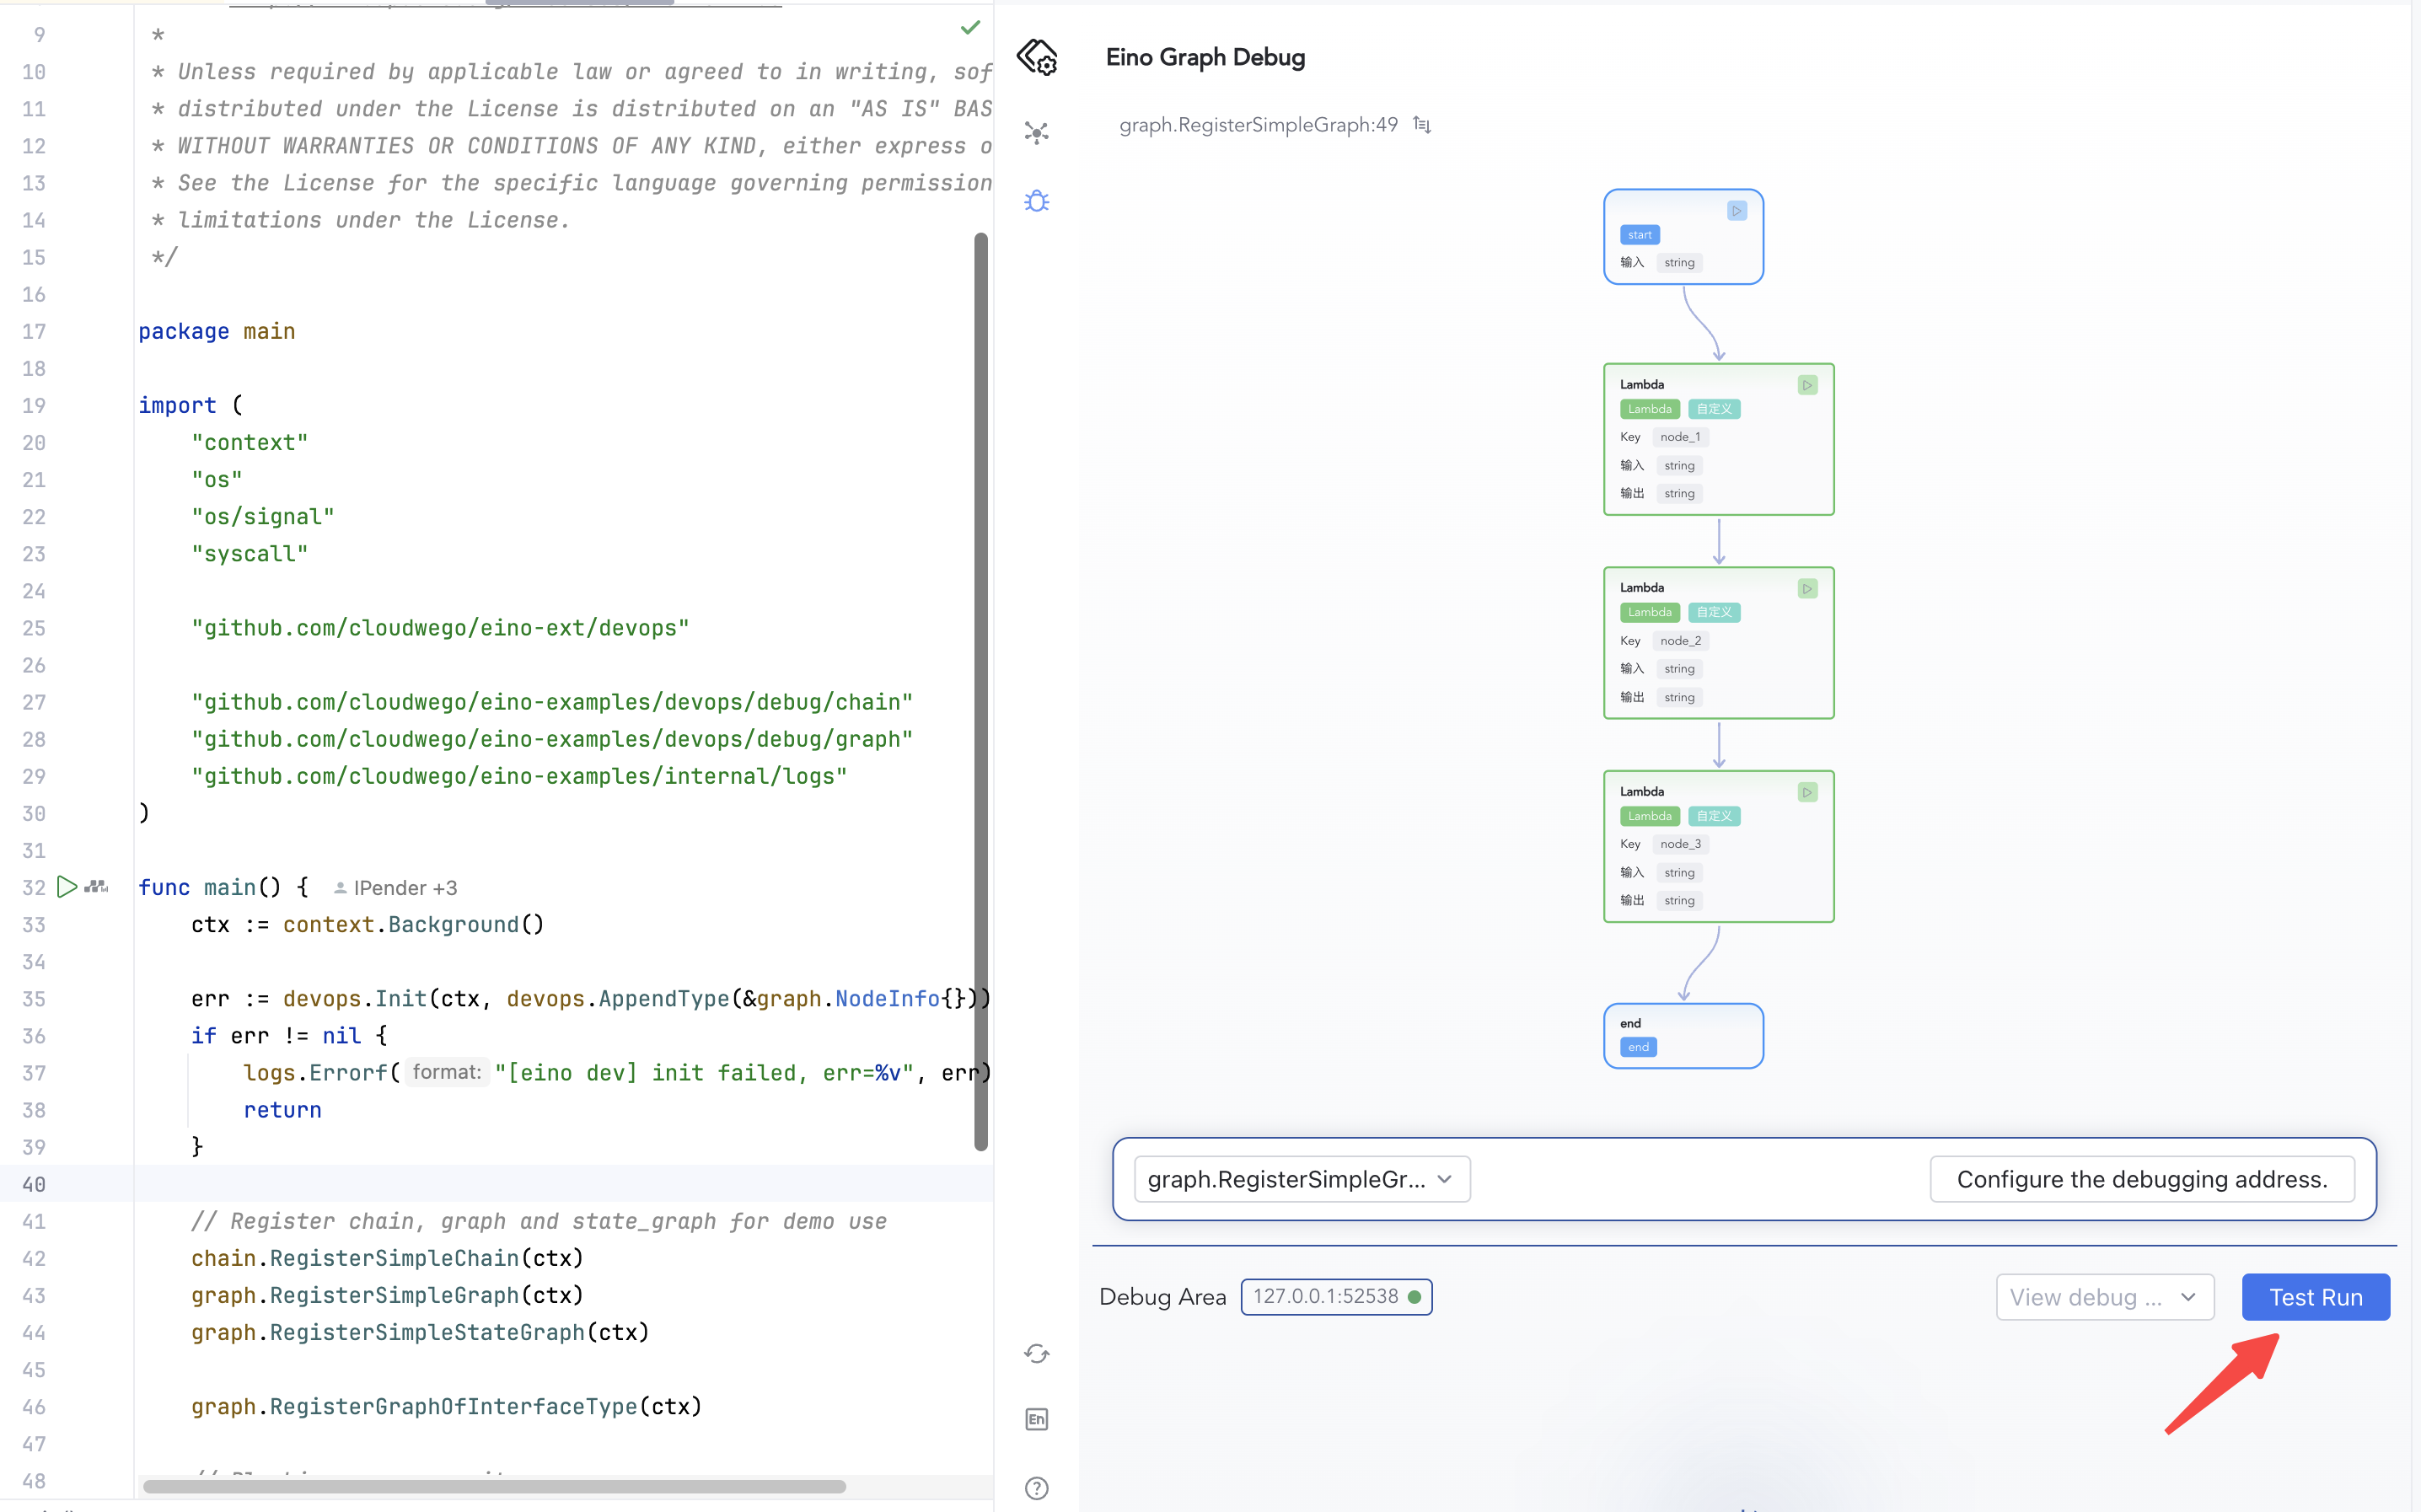
4.Click Confirm to enter the debug interface, selecting the Graph to debug
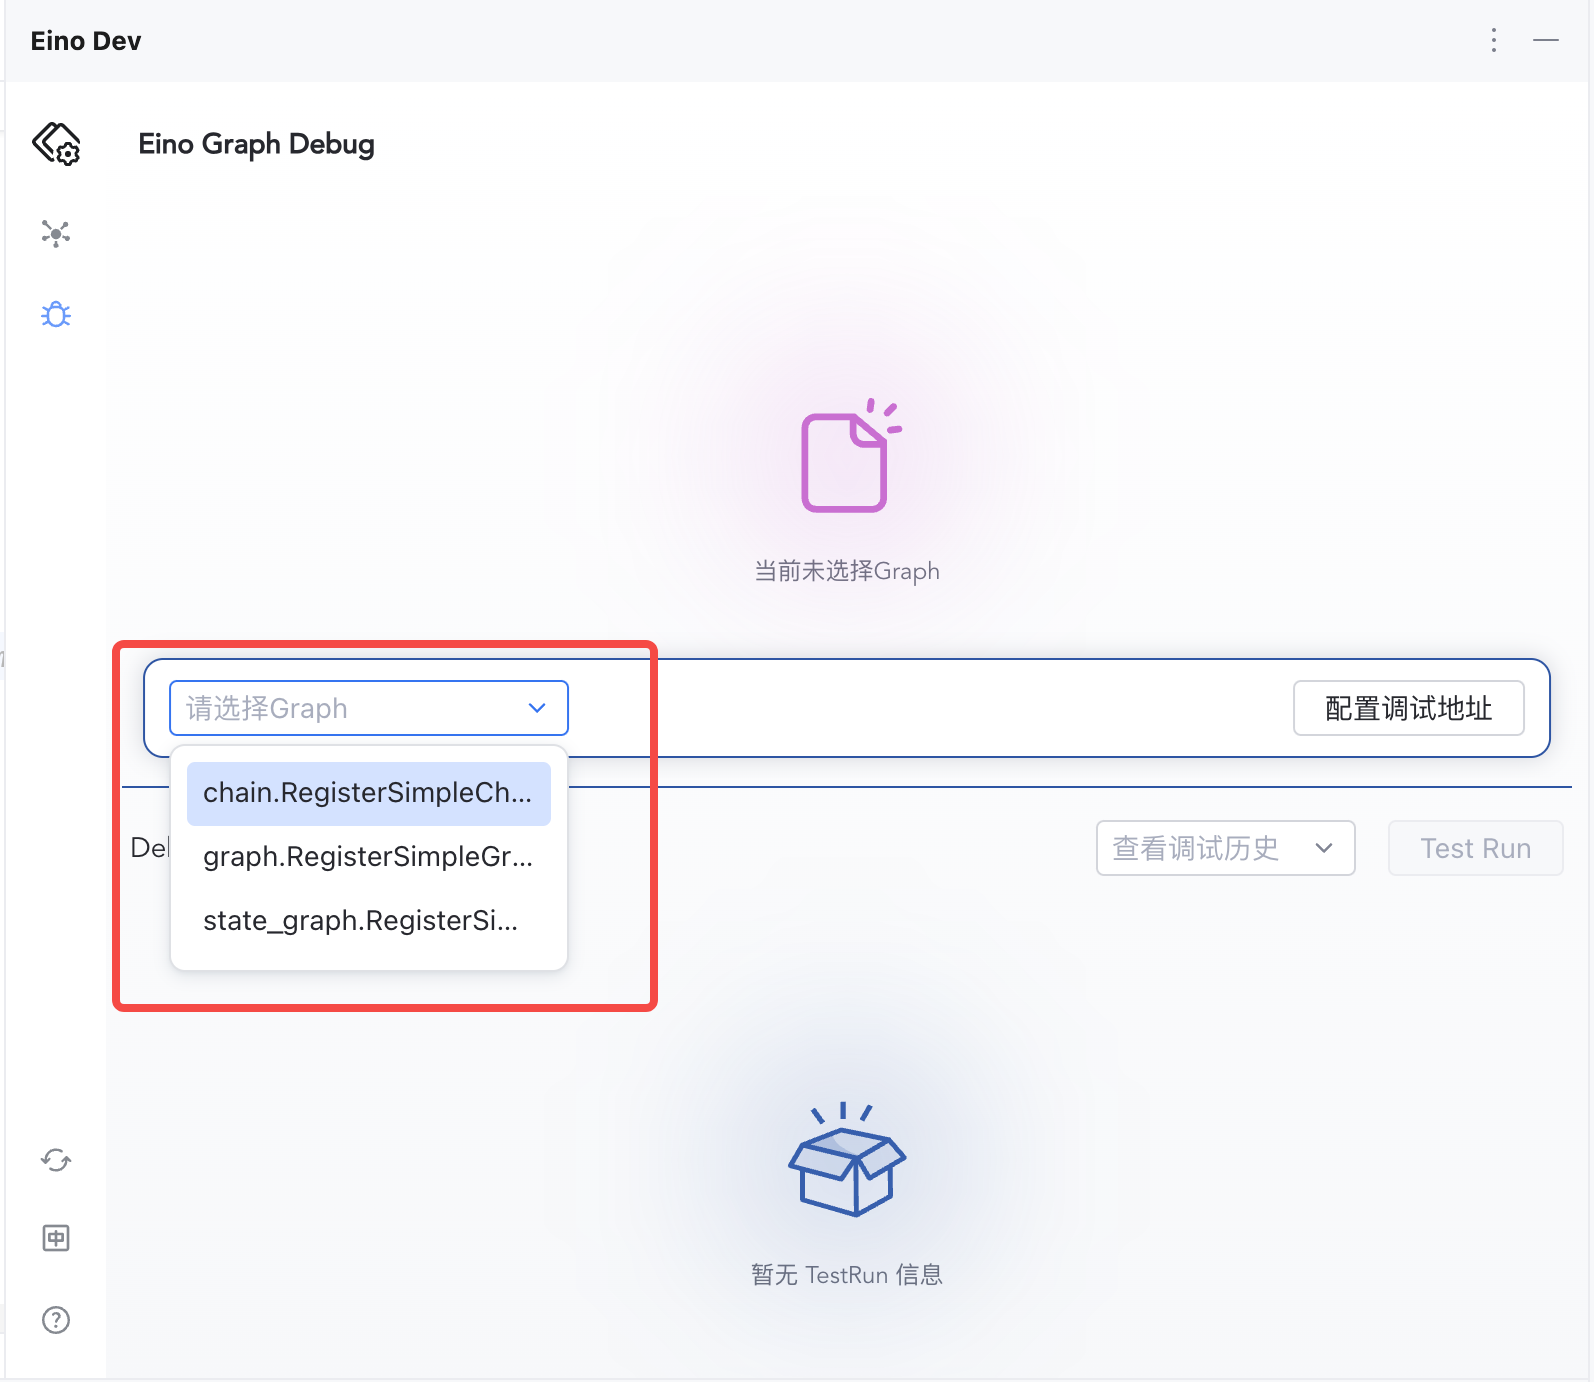
|
Start Debugging
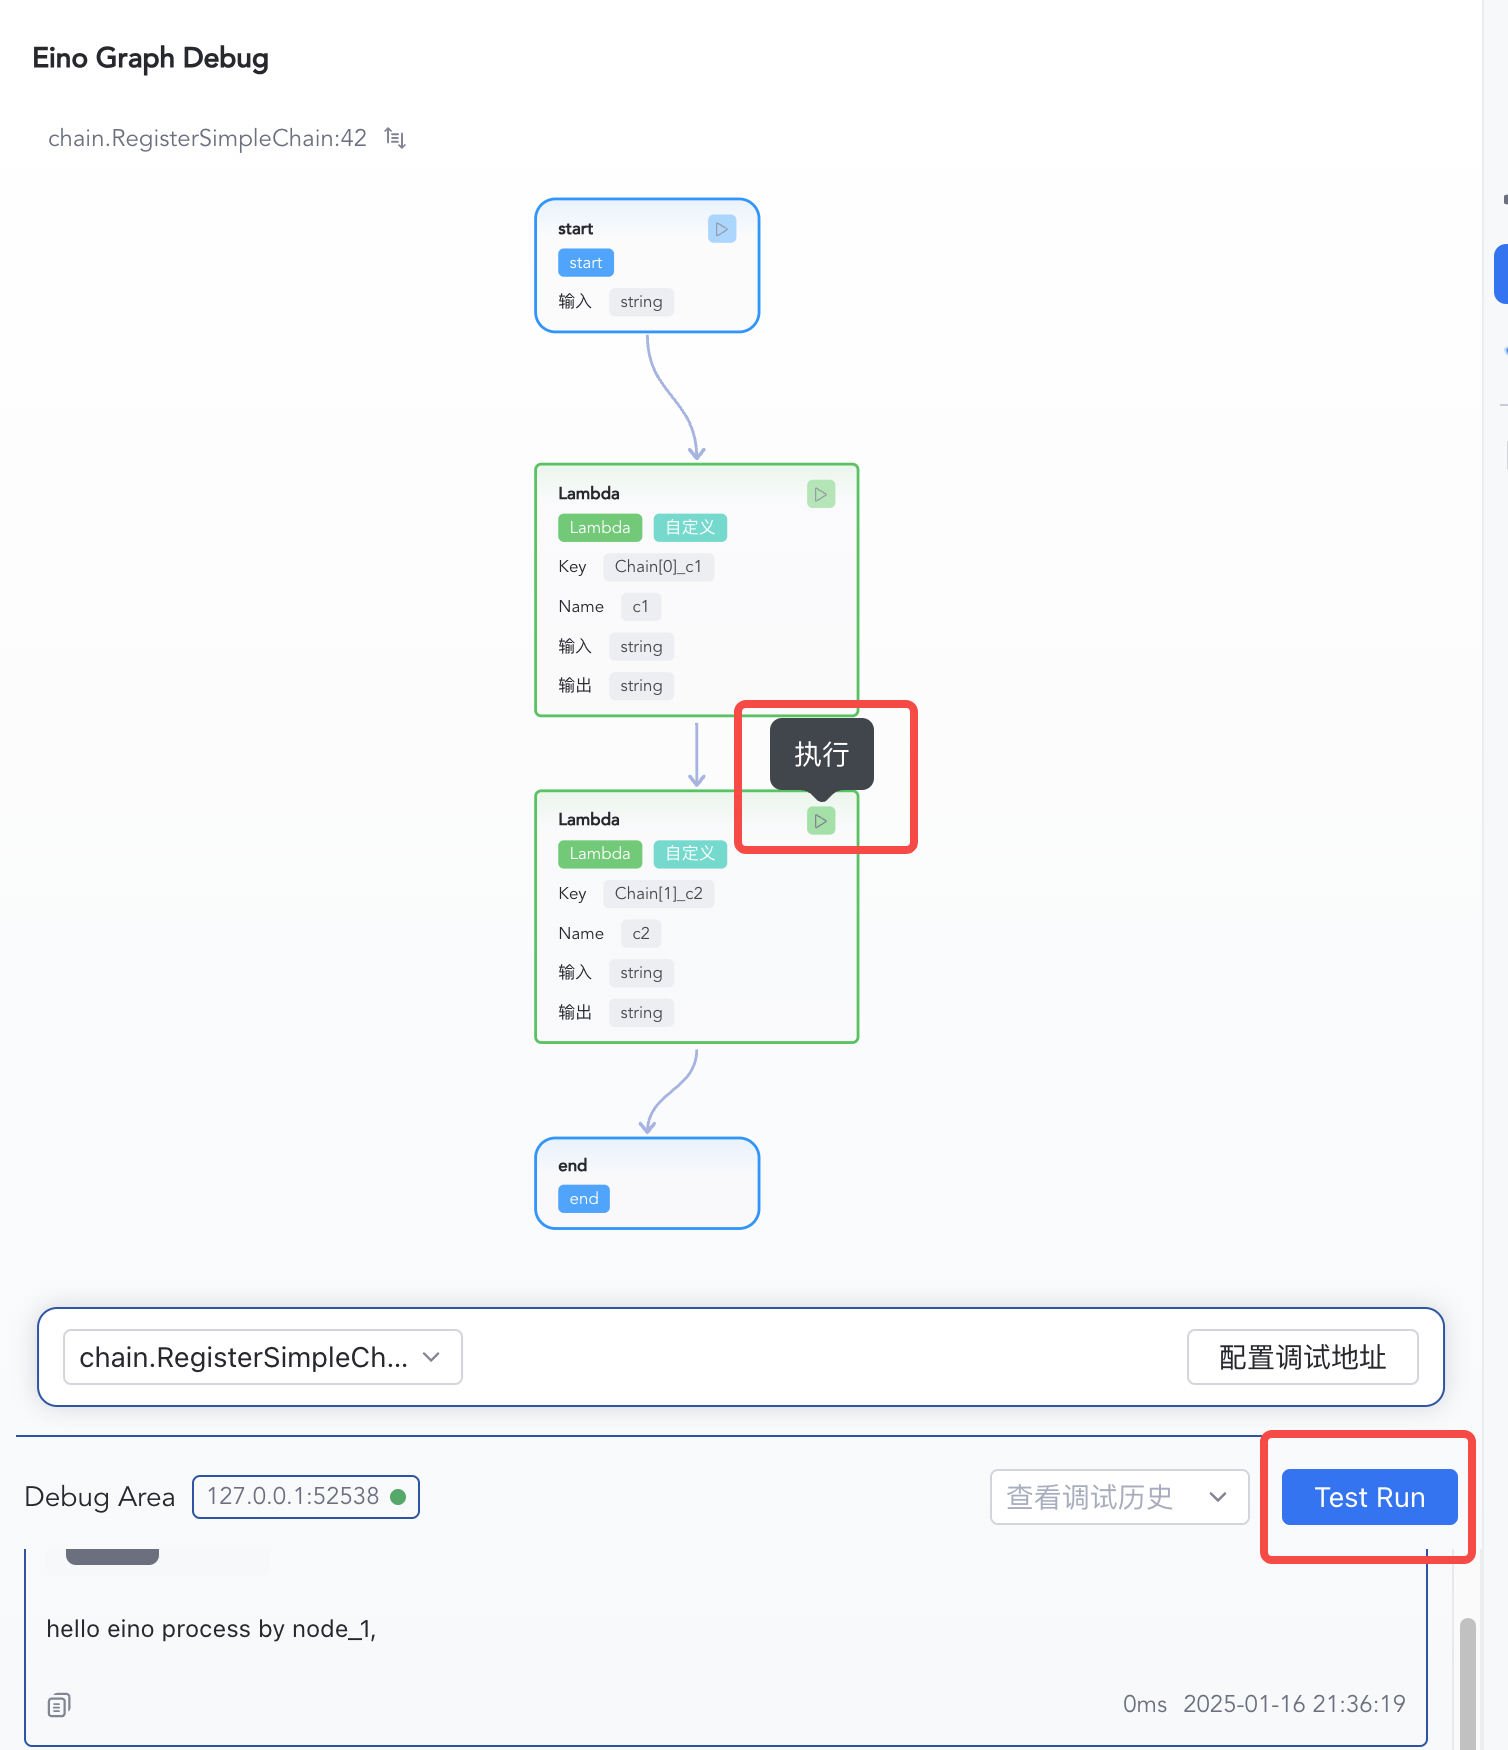
1.Click "Test Run" to execute from the start node
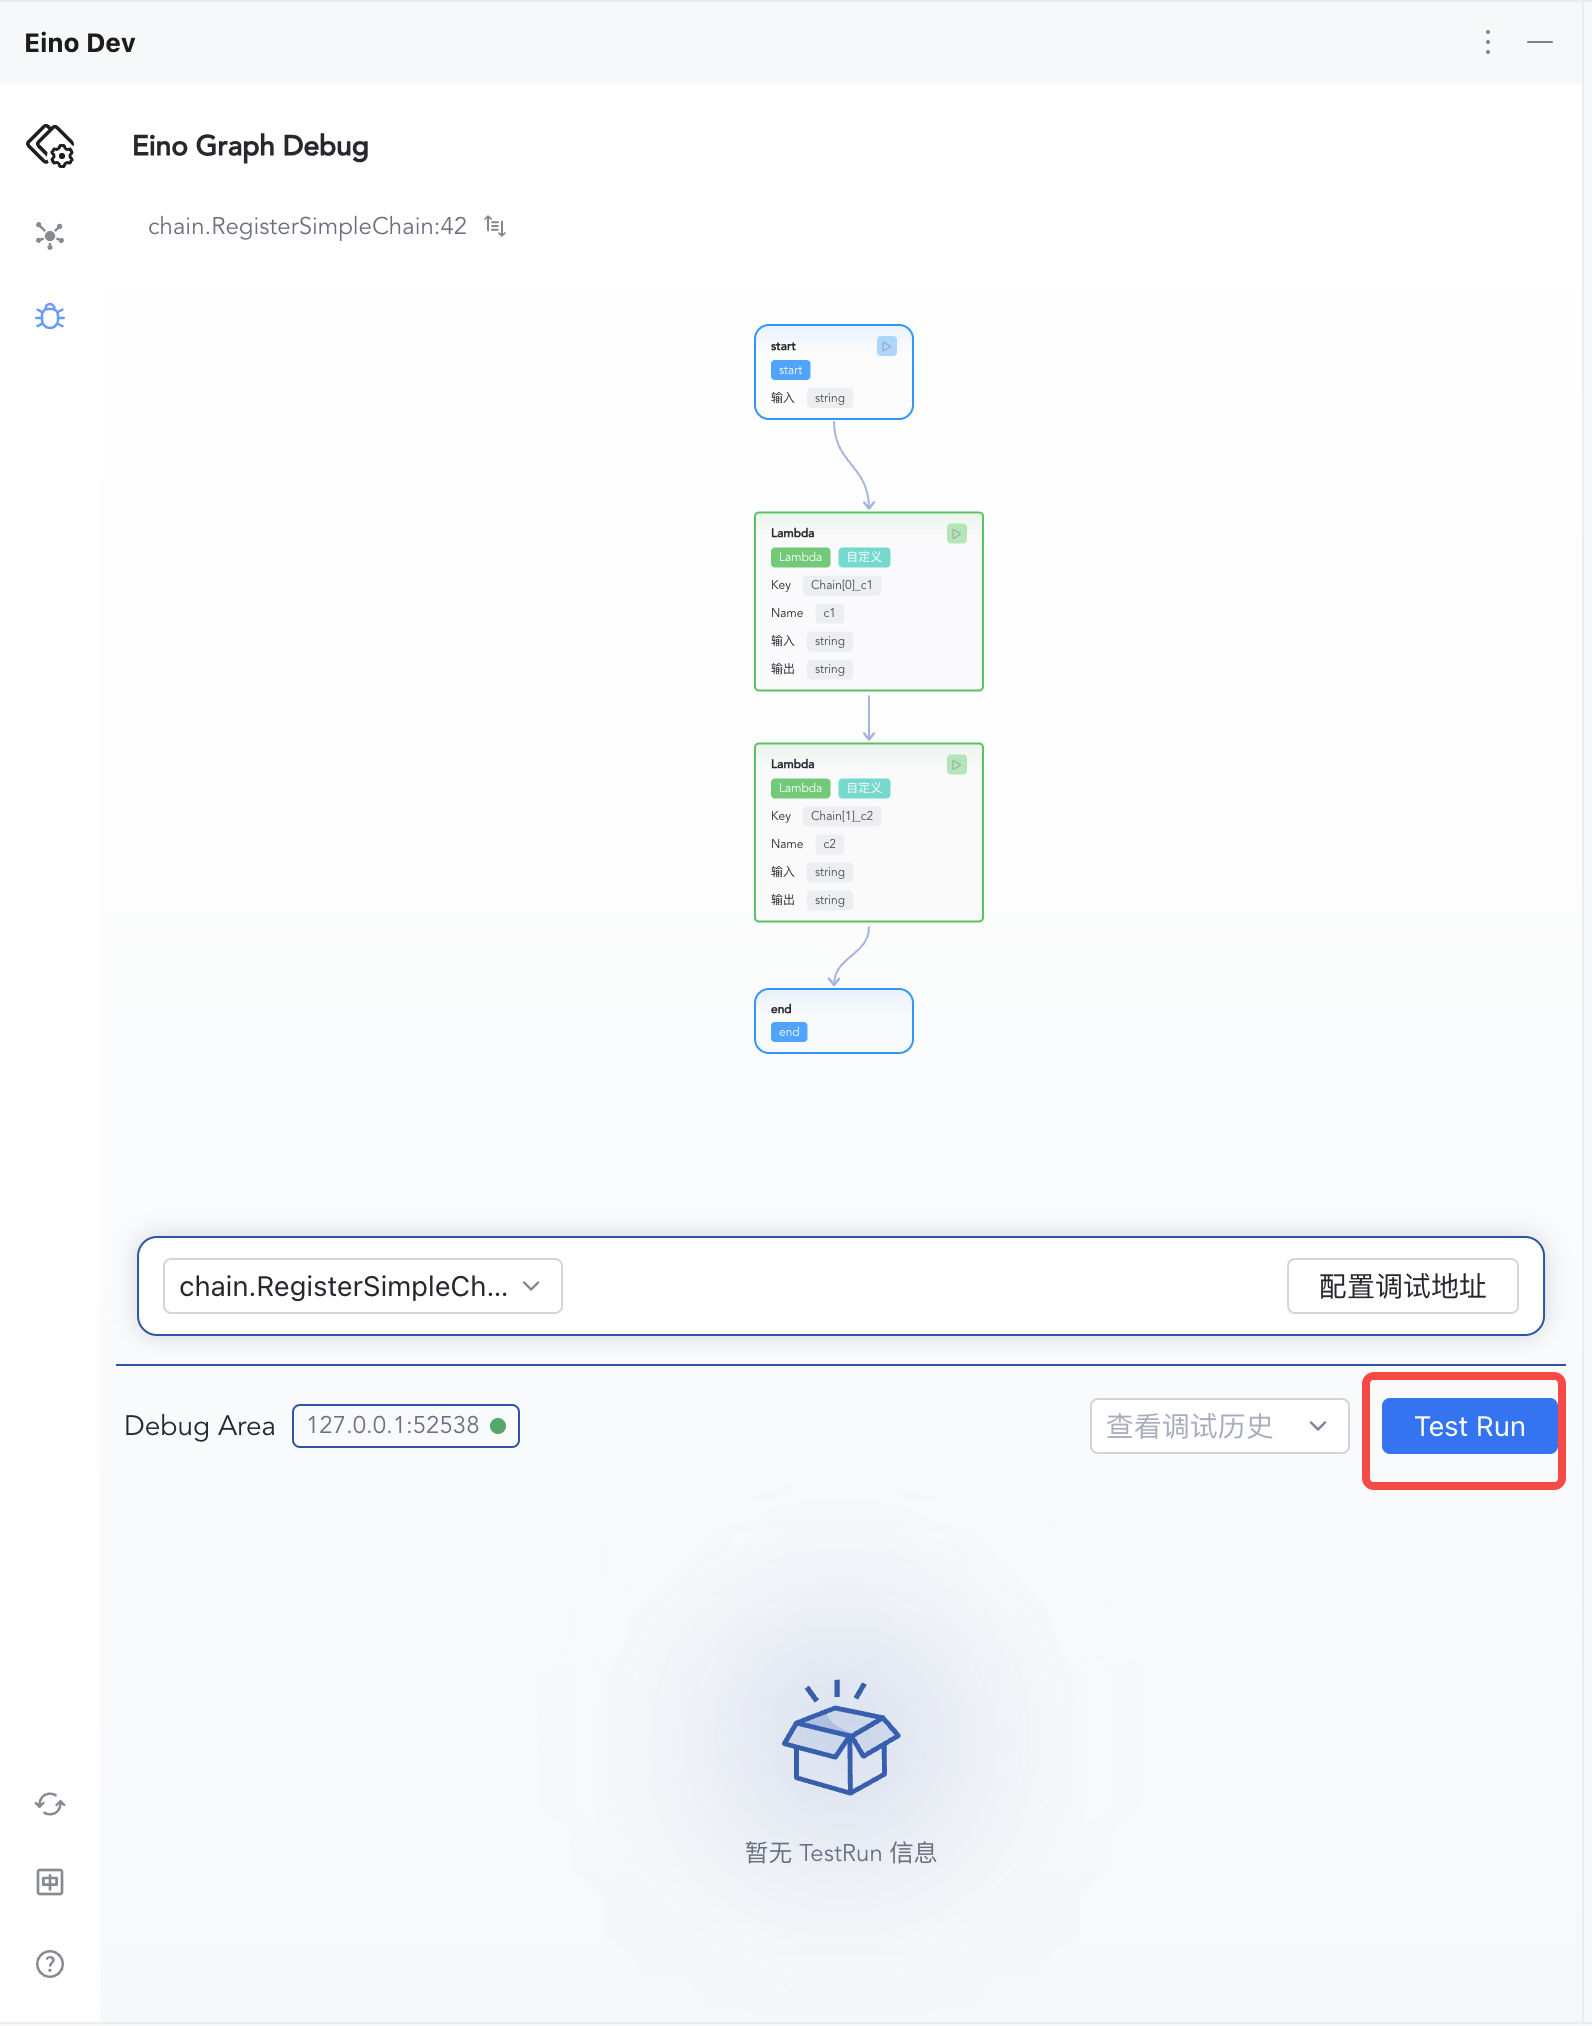
|
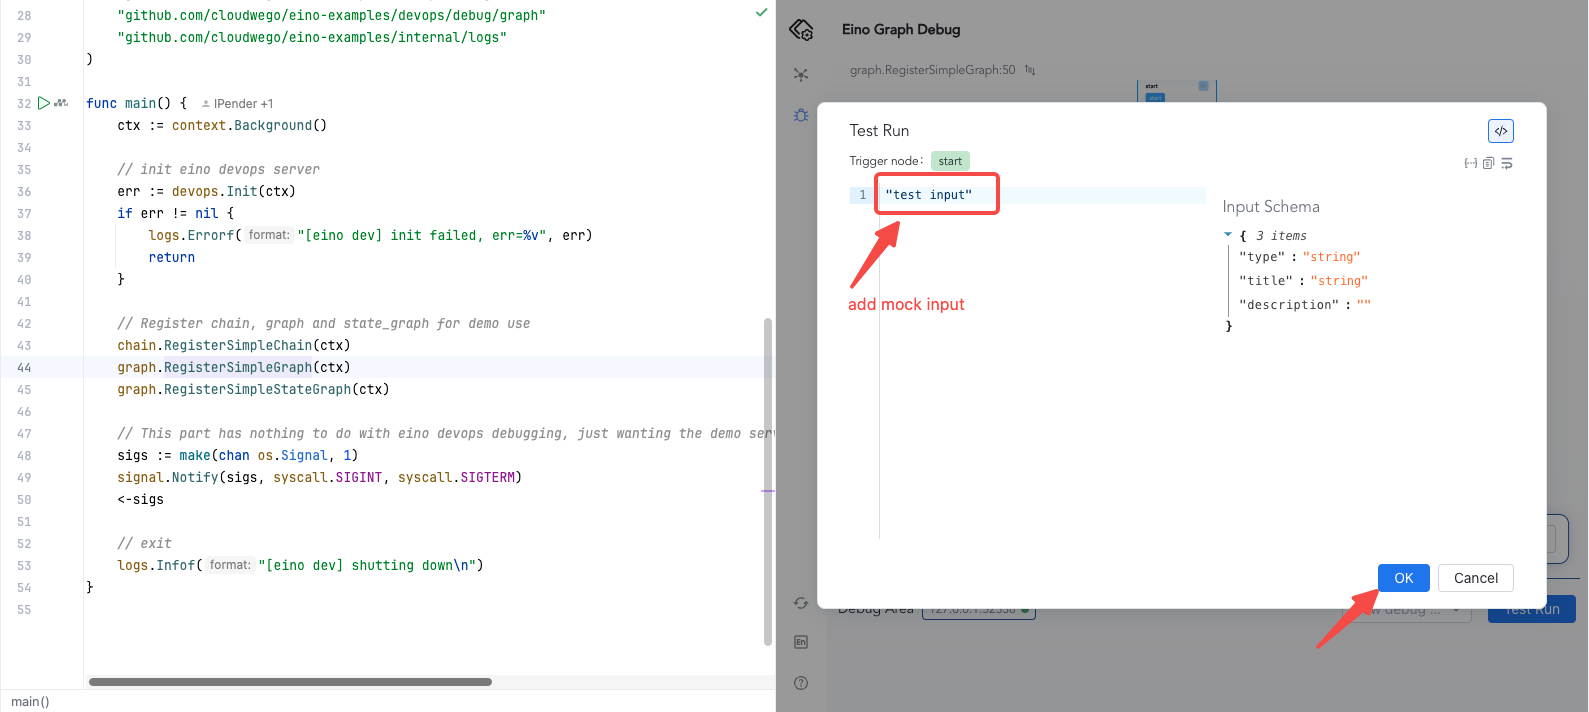
2.Enter "hello eino", and click Confirm
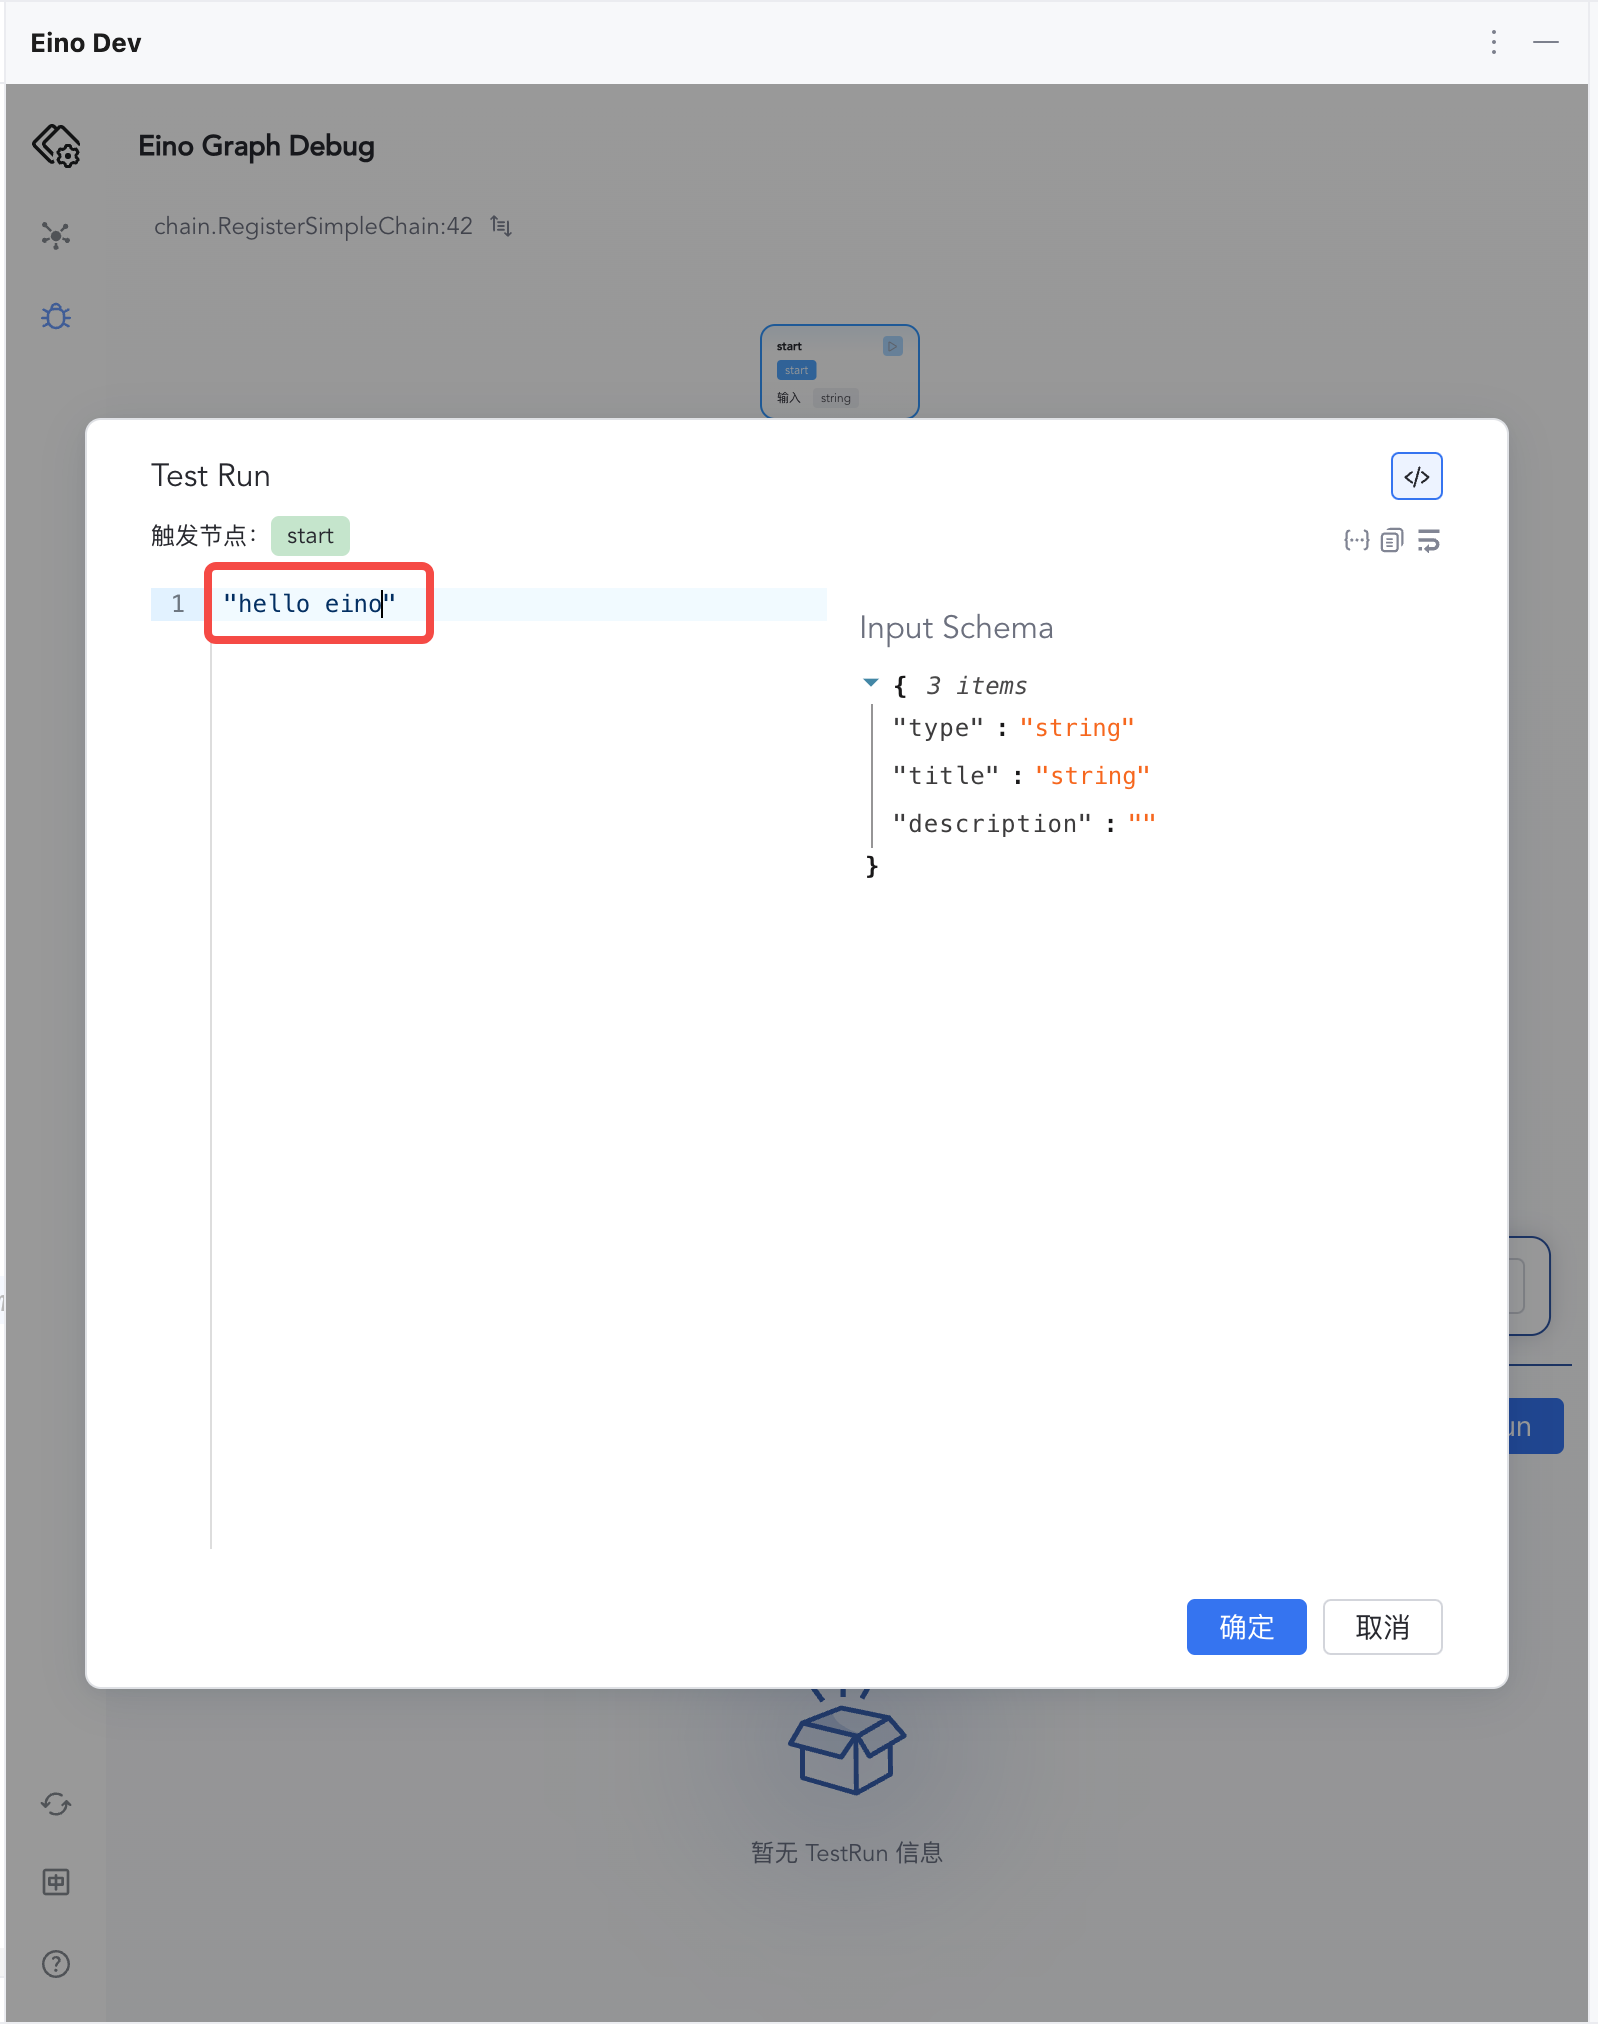
|
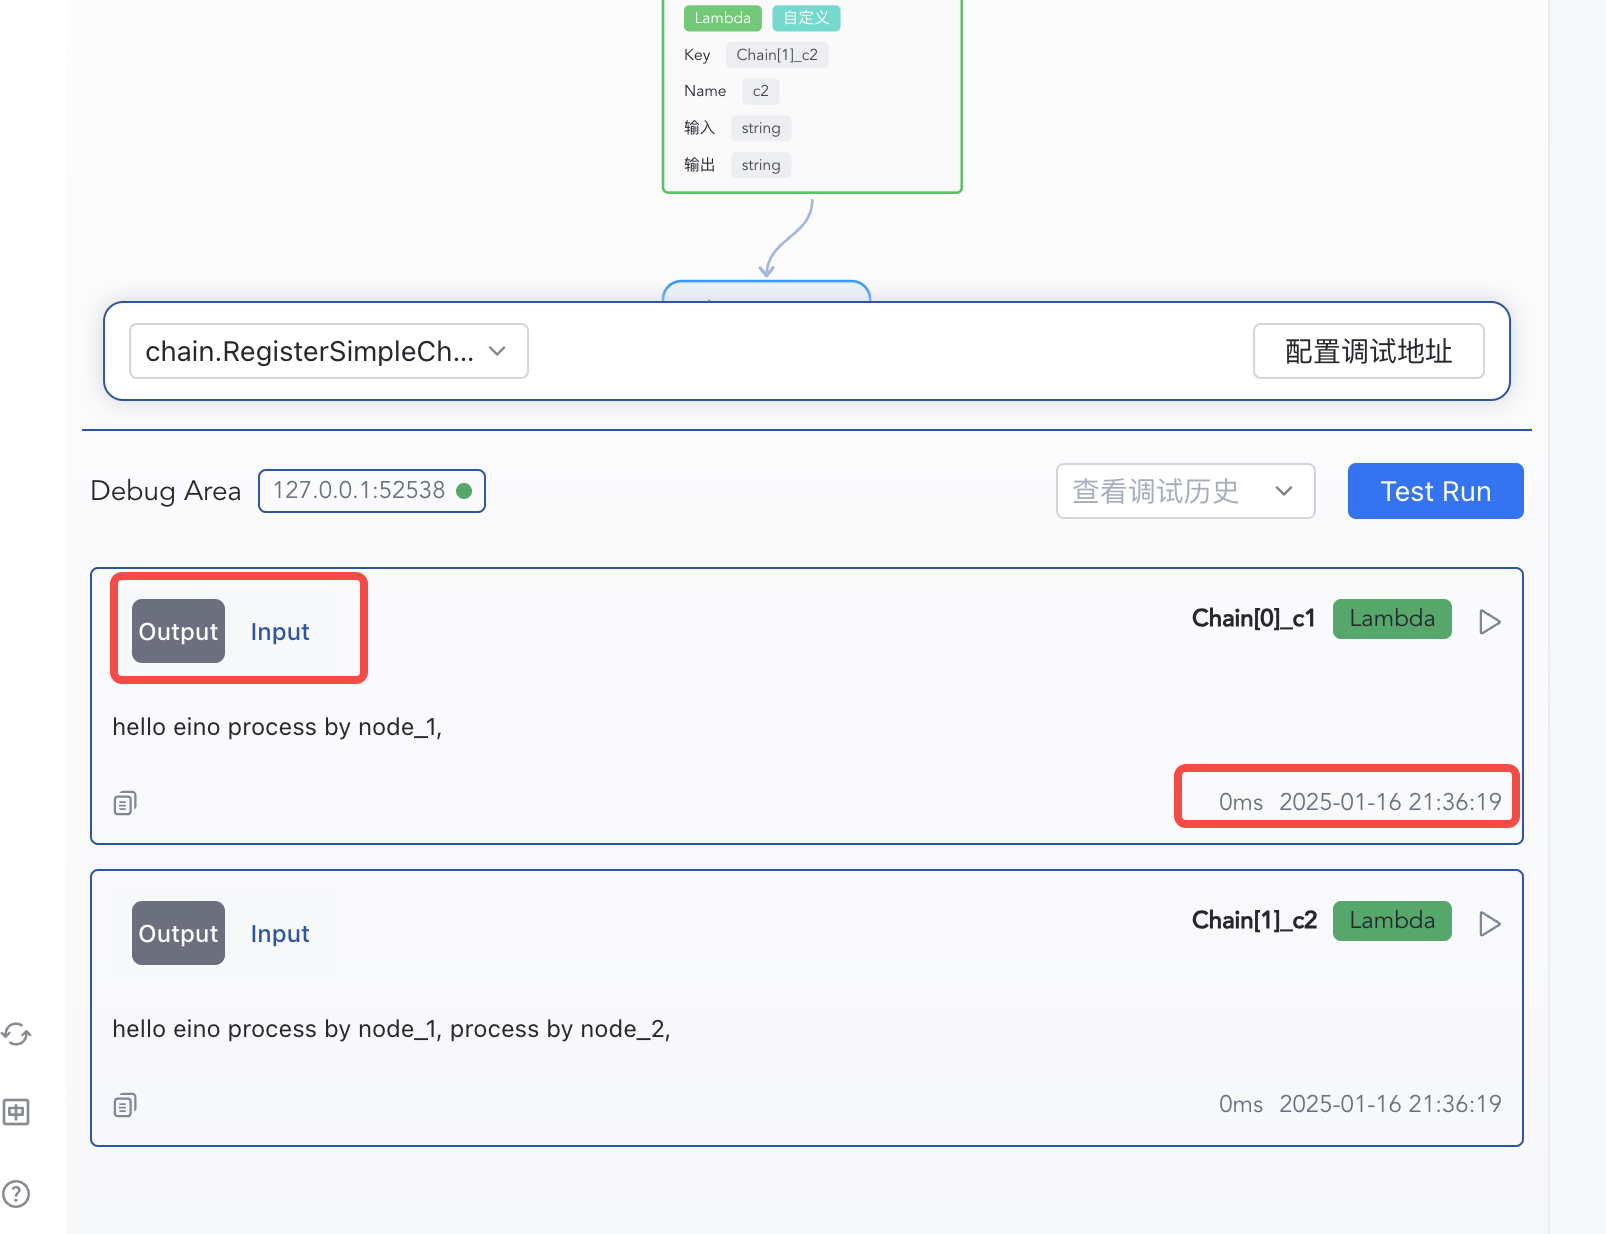
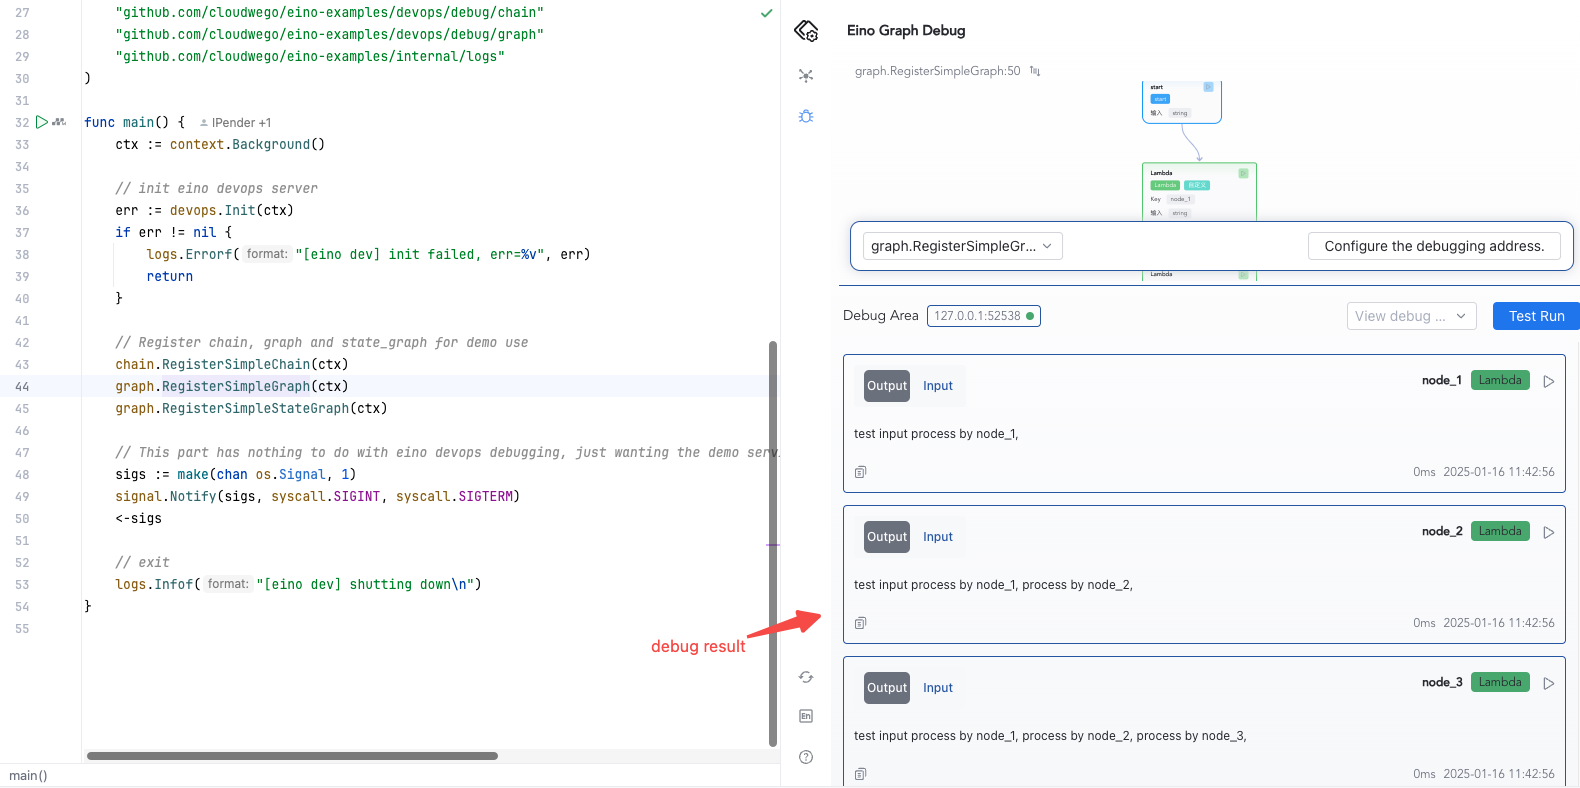
3.The debugging area displays the input and output of each node
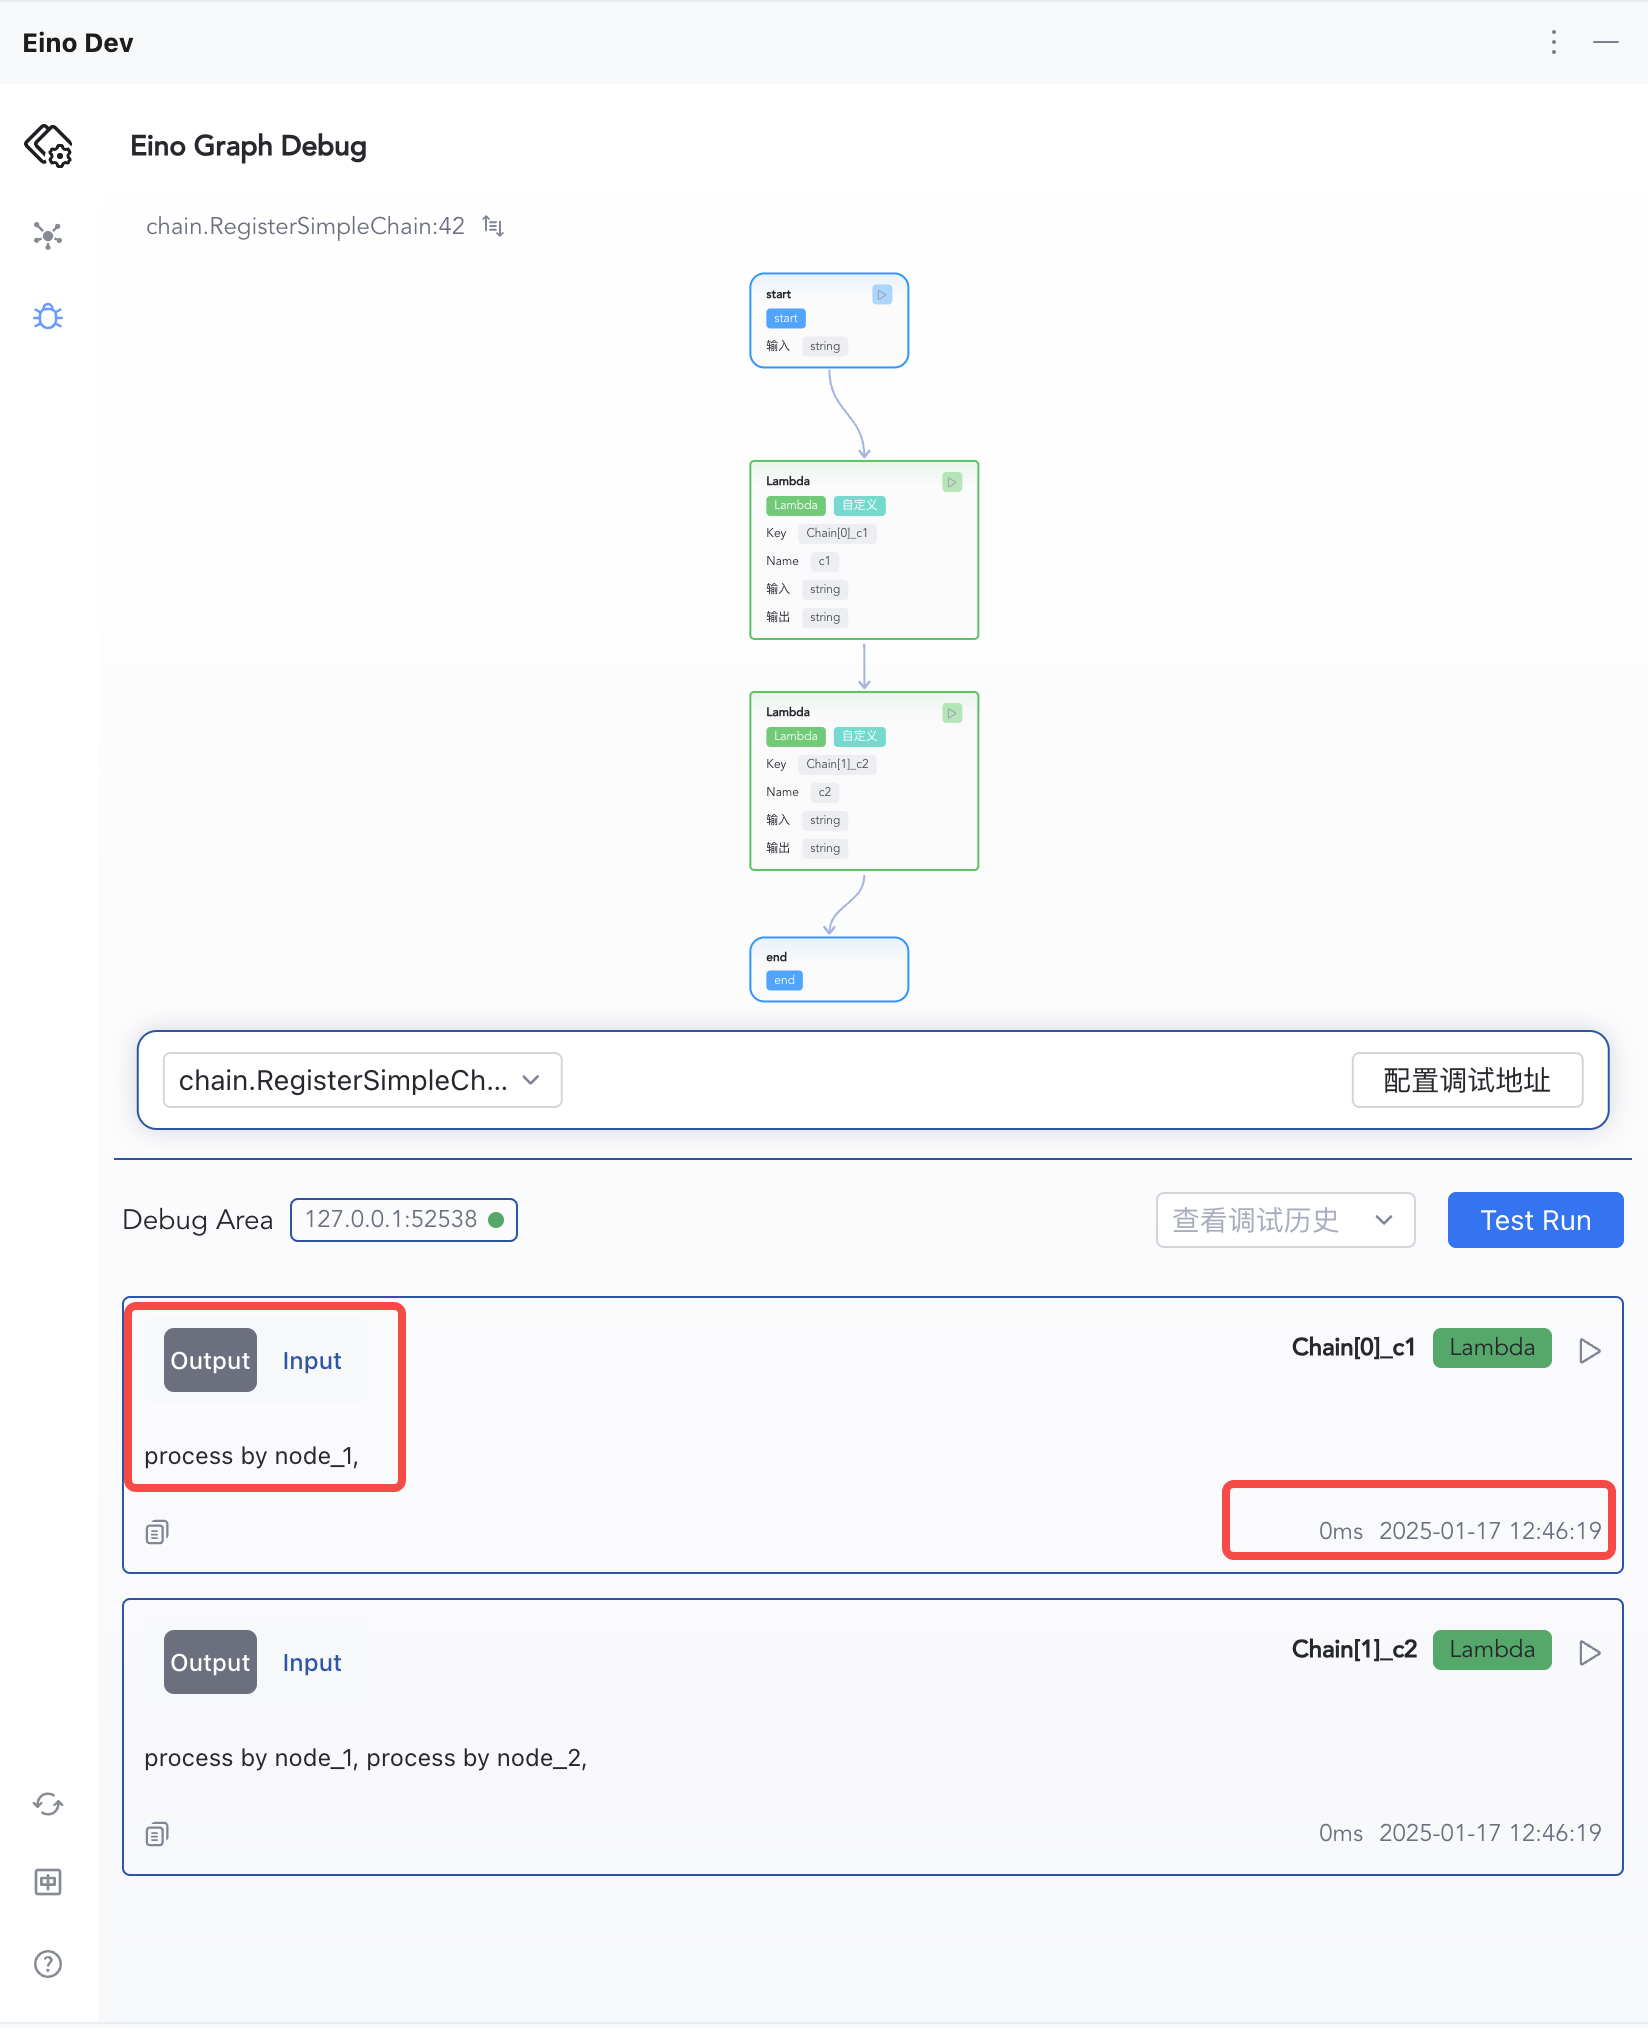
|
4.Click Input and Output to switch and view node information
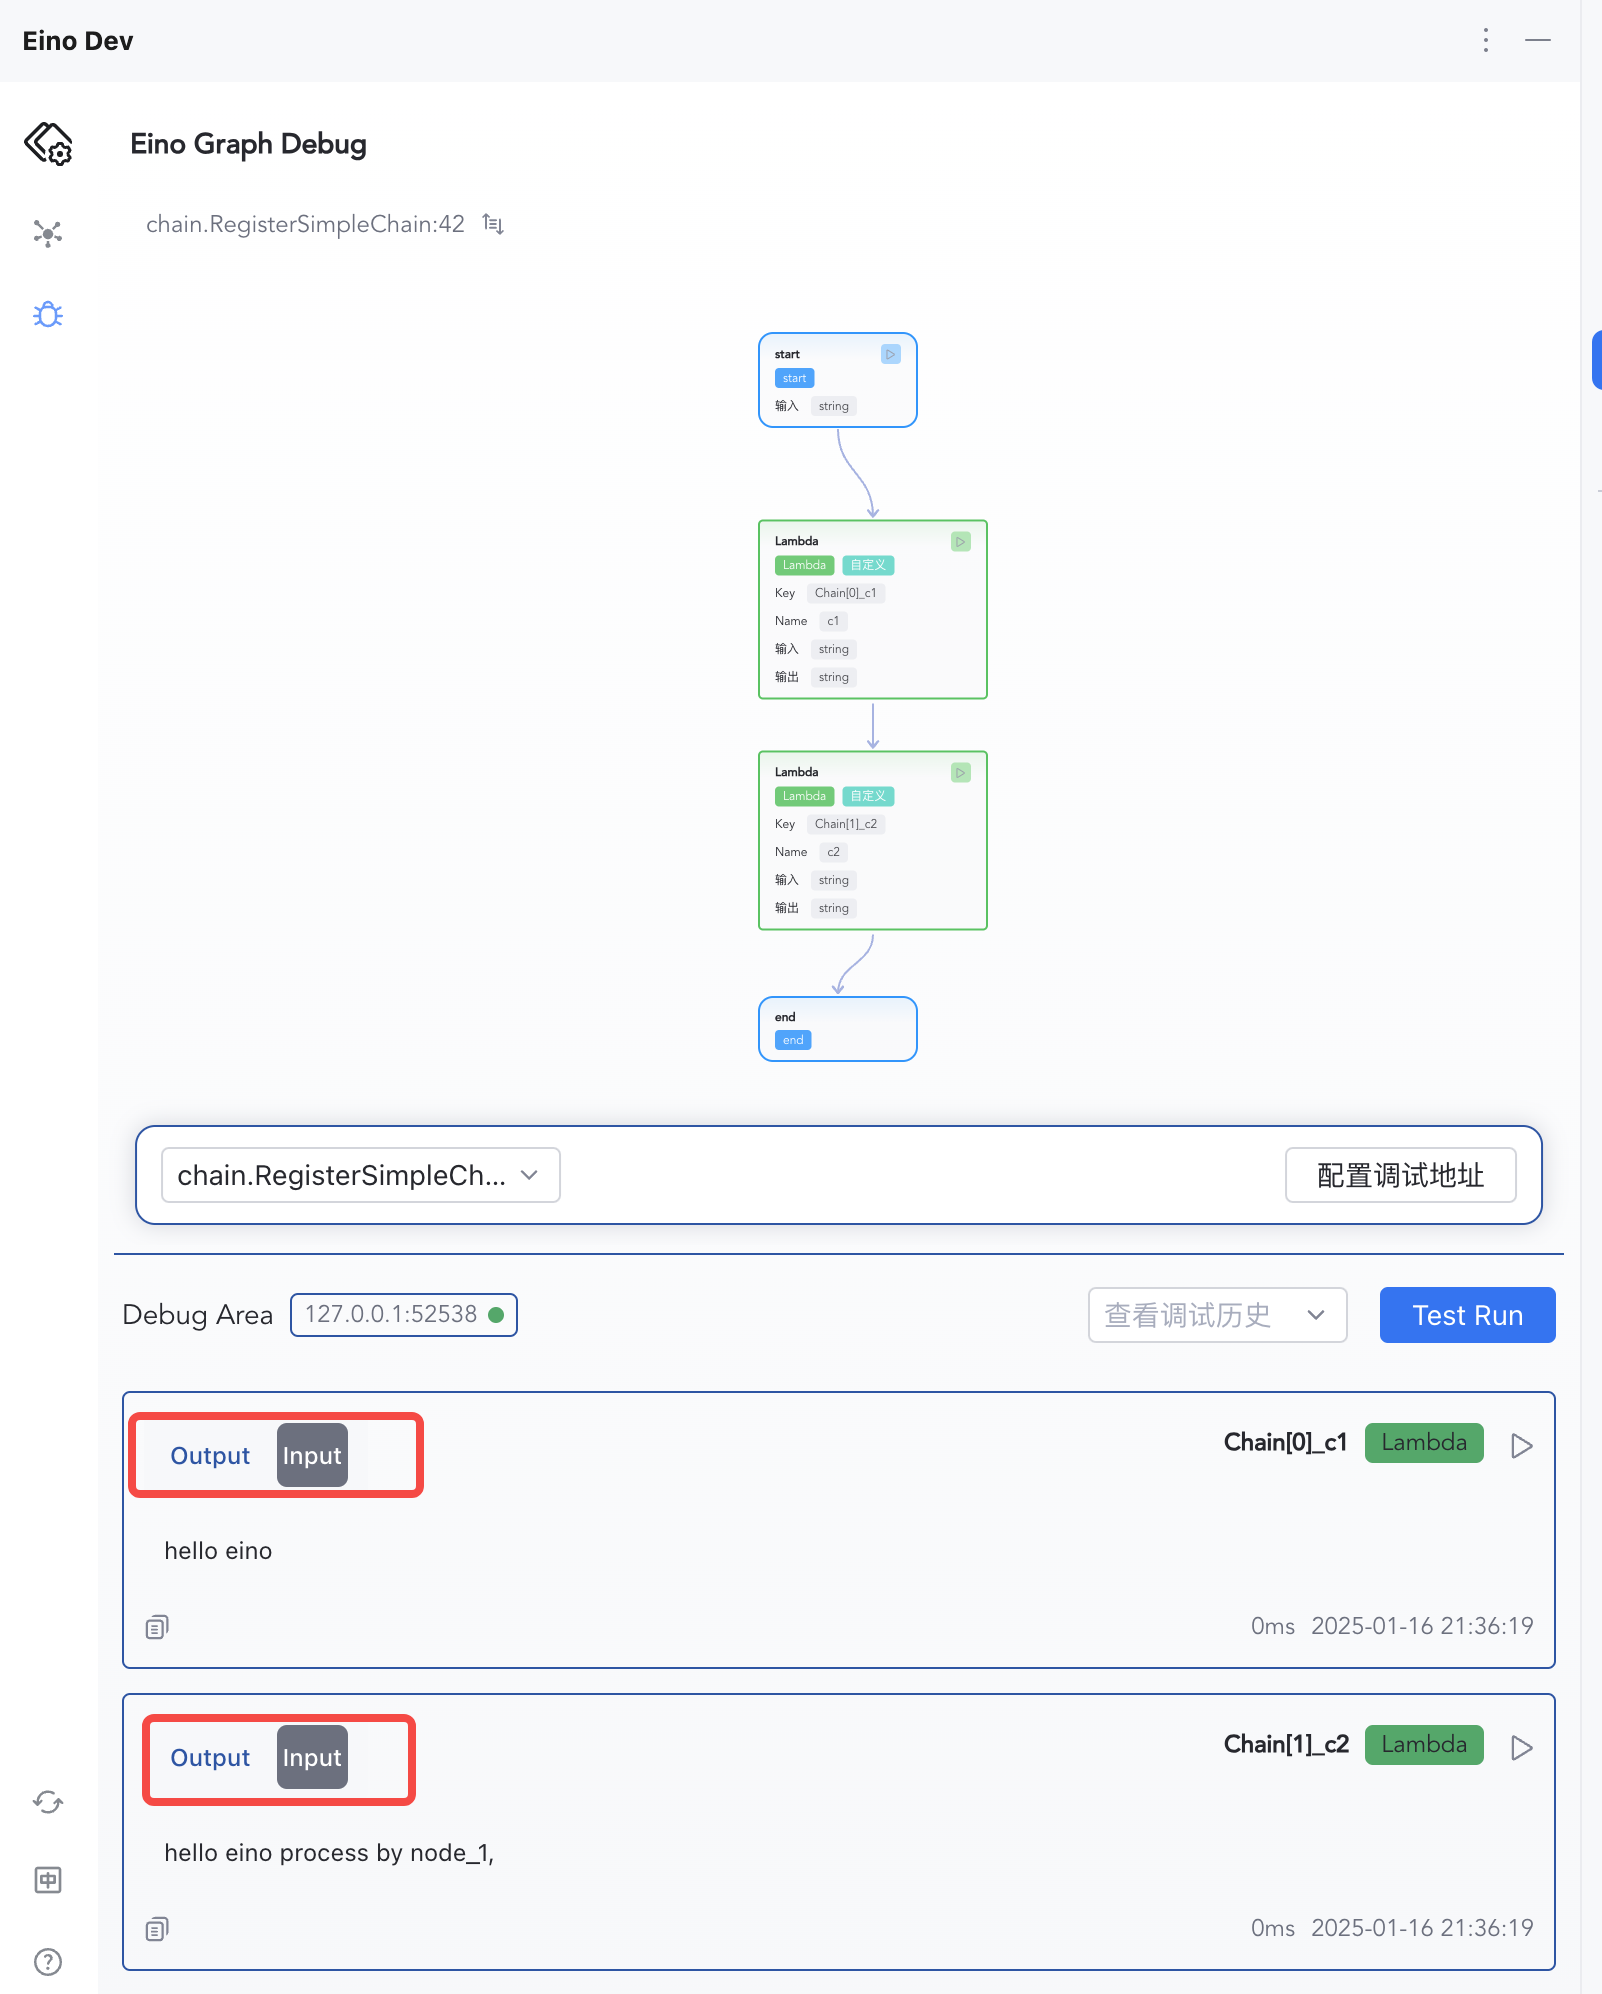
|
Features Overview
Local or Remote Debugging
Regardless of whether the target debugging orchestration output is on a local computer or a remote server, you can actively connect to the server where the target debugging object is located by configuring IP:Port.
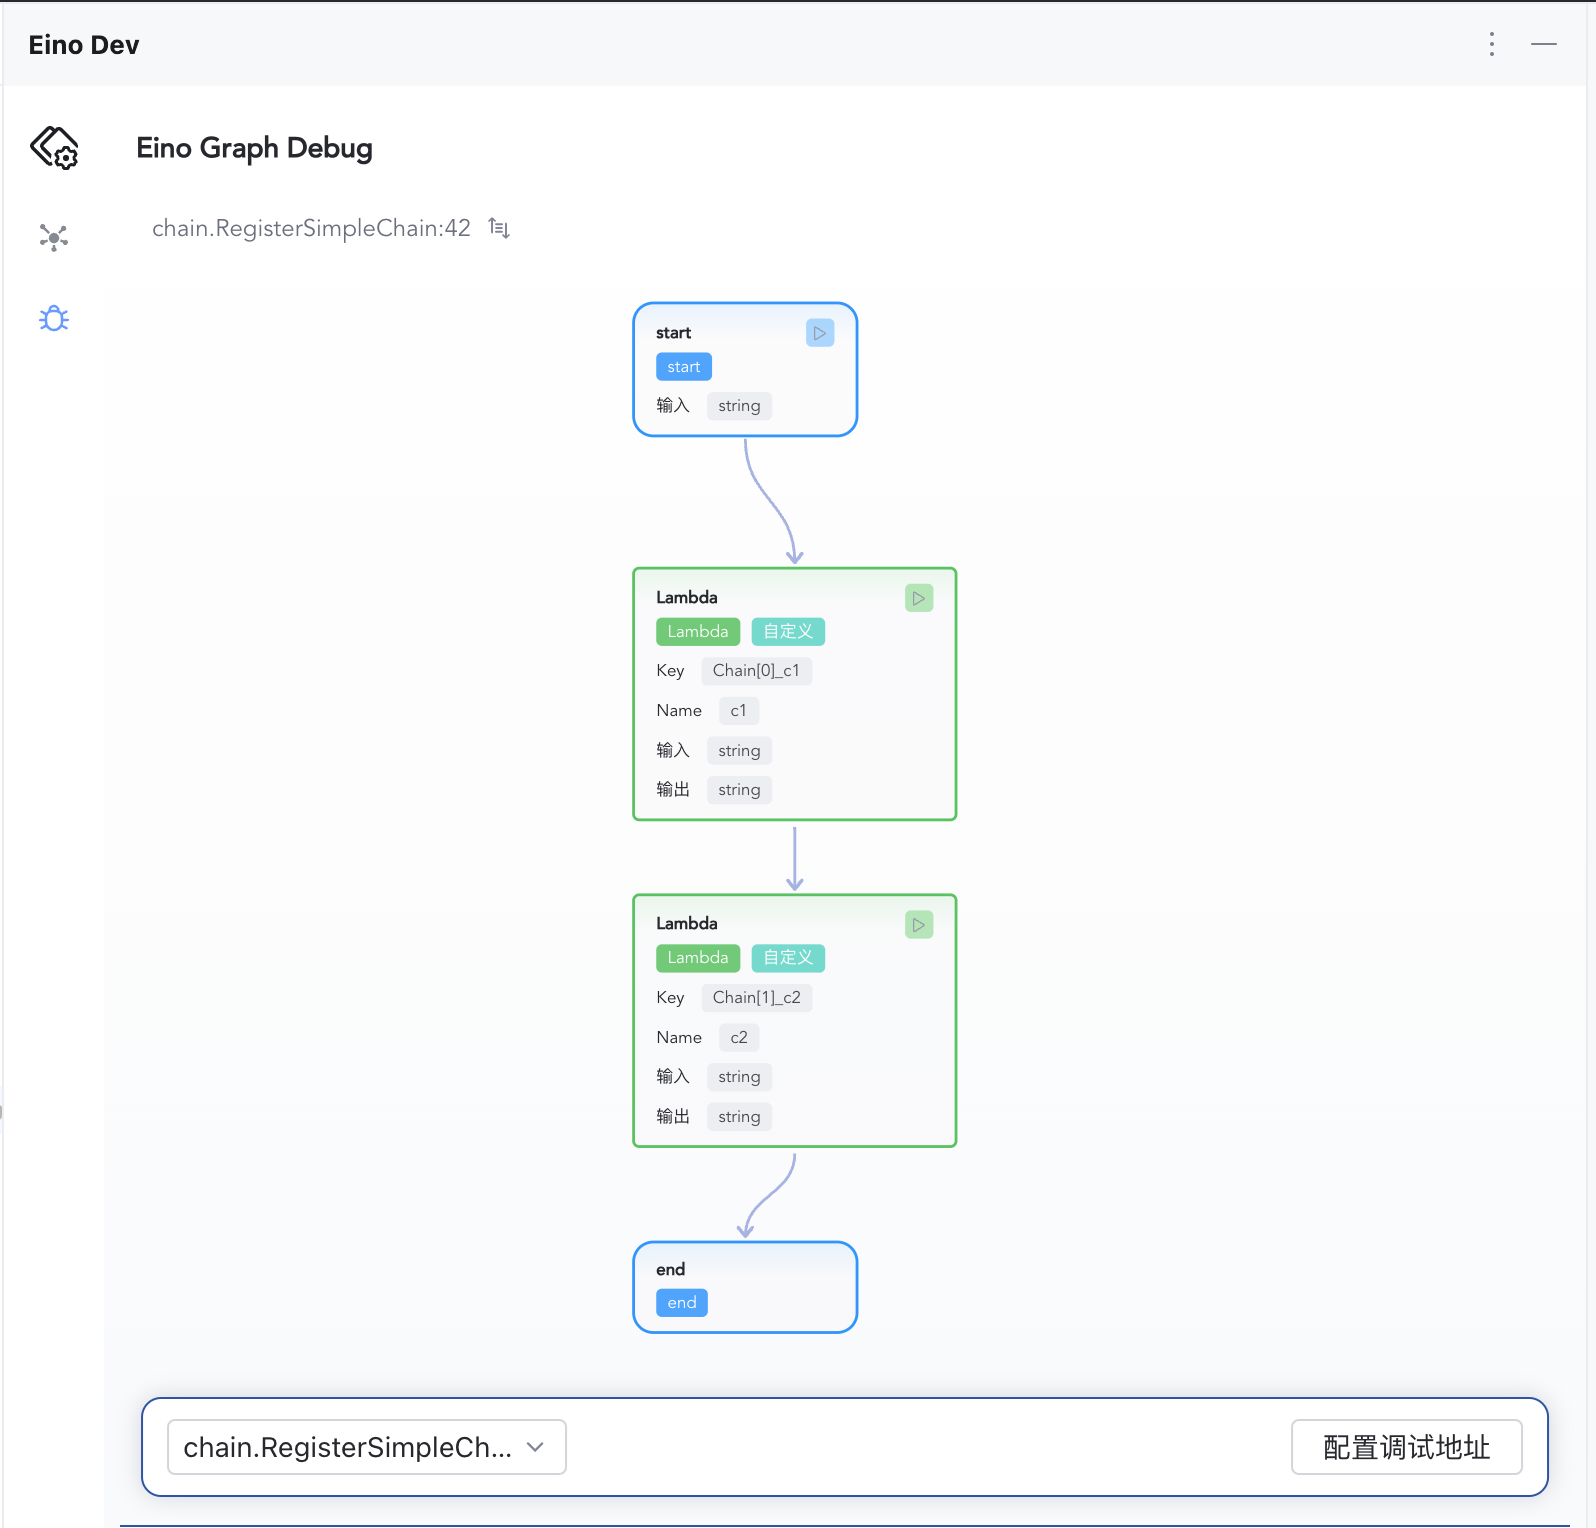
Orchestration Topology Visualization
Supports Graph and Chain orchestration topology visualization.
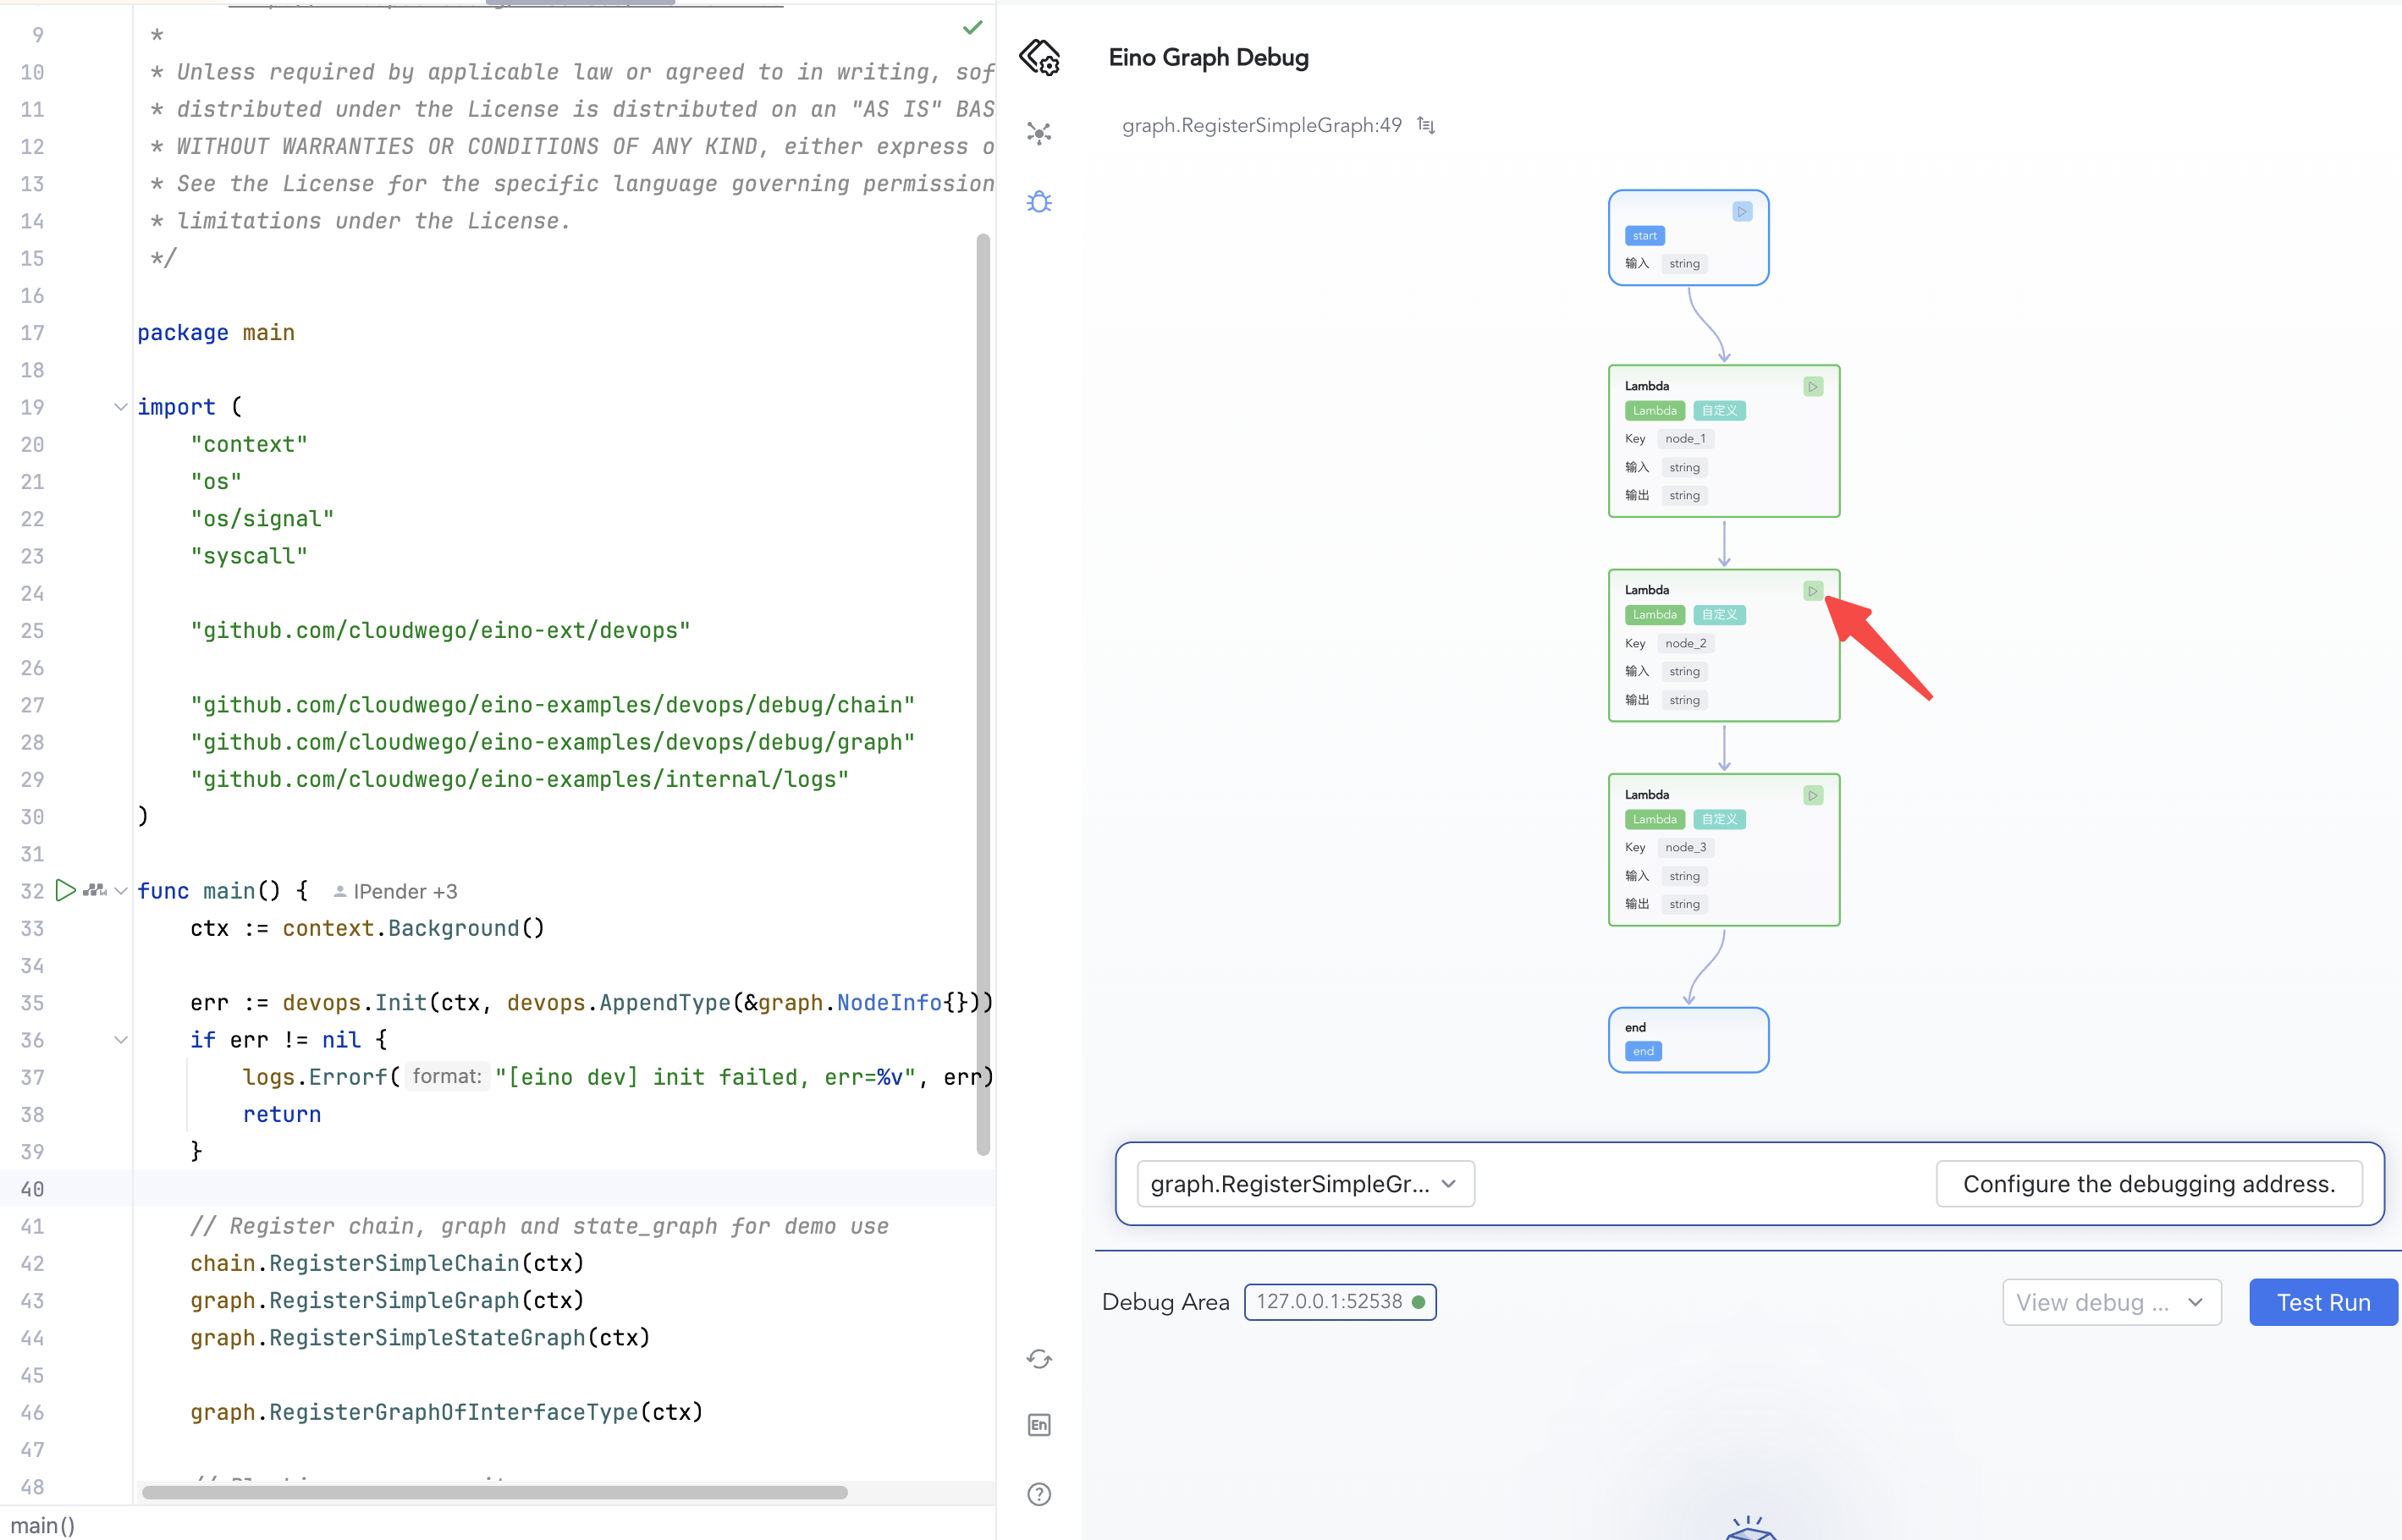
Debug From Any Node
View Node Execution Results
The execution results of each node are displayed in the debugging area in the order of execution, including: input, output, execution time
Debugging From Scratch
Orchestrating with Eino
The plugin supports debugging the orchestration outputs of Graph and Chain. Assuming you already have the following orchestration code:
func RegisterSimpleGraph(ctx context.Context) {
    g := compose.NewGraph[string, string]()
    _ = g.AddLambdaNode("node_1", compose.InvokableLambda(func(ctx context.Context, input string) (output string, err error) {
       return input + " process by node_1,", nil
    }))
    _ = g.AddLambdaNode("node_2", compose.InvokableLambda(func(ctx context.Context, input string) (output string, err error) {
       return input + " process by node_2,", nil
    }))
    _ = g.AddLambdaNode("node_3", compose.InvokableLambda(func(ctx context.Context, input string) (output string, err error) {
       return input + " process by node_3,", nil
    }))

    _ = g.AddEdge(compose.START, "node_1")
    _ = g.AddEdge("node_1", "node_2")
    _ = g.AddEdge("node_2", "node_3")
    _ = g.AddEdge("node_3", compose.END)

    _, err := g.Compile(ctx)
    if err != nil {
       logs.Errorf("compile graph failed, err=%v", err)
       return
    }
}
Install Dependencies
In the project directory, execute the following commands in sequence:
# 1. Pull latest devops repository
go get github.com/cloudwego/eino-ext/devops@latest

# 2. Cleans and updates go.mod and go.sum
go mod tidy
Call Debug Initialization Function
Because debugging requires starting an HTTP service in the user’s main process to interact with local debugging plugins, the user needs to proactively call Init() from github.com/cloudwego/eino-ext/devops to start the debugging service.
💡 Notice:
- Make sure that the orchestration product of the target debugging has executed
Compile()at least once.- The execution of
devops.Init()must be carried out before callingCompile().- Users need to ensure that the main process does not exit after the execution of
devops.Init().
For example, adding the debugging service startup code in the main() function:
// 1. Call the debug service initialization function
err := devops.Init(ctx)
if err != nil {
    logs.Errorf("[eino dev] init failed, err=%v", err)
    return
}

// 2. Compile the target debug orchestration artifact
RegisterSimpleGraph(ctx)
Run User Process
Run your process on a local computer or remote environment and ensure the main process does not exit.
In github.com/cloudwego/eino-examples/devops/debug/main.go, the main() code is as follows:
func main() {
    ctx := context.Background()
    // Init eino devops server
    err := devops.Init(ctx)
    if err != nil {
       logs.Errorf("[eino dev] init failed, err=%v", err)
       return
    }

    // Register chain, graph and state_graph for demo use
    chain.RegisterSimpleChain(ctx)
    graph.RegisterSimpleGraph(ctx)
    graph.RegisterSimpleStateGraph(ctx)

    // Blocking process exits
    sigs := make(chan os.Signal, 1)
    signal.Notify(sigs, syscall.SIGINT, syscall.SIGTERM)
    <-sigs

    // Exit
    logs.Infof("[eino dev] shutting down\n")
}
Configure Debug Address
- IP:The IP address of the server where the user process is running.
- If the user process is running on a local computer, enter
127.0.0.1. - If the user process is running on a remote server, enter the remote server’s IP address, compatible with both IPv4 and IPv6.
- If the user process is running on a local computer, enter
- Port:The port on which the debugging service is listening, default is
52538, and can be modified using theWithDevServerPortoption method.
💡 Notes
- Local computer debugging: The system might pop up a network access warning, just allow the access.
- Remote server debugging: You need to ensure the port is accessible.
After configuring the IP and Port, click confirm, and the debugging plugin will automatically connect to the target debugging server. If successfully connected, the connection status indicator will turn green.
Select Target Debugging Orchestration
Ensure the orchestration product you want to debug has been executed at least once using Compile(). Since debugging is designed for instances of orchestration product, multiple executions of Compile() will register multiple products with the debugging service, resulting in multiple selectable debugging targets in the list.
Start Debugging
Debugging can start from any node, including the start node and other intermediate nodes.
- Start debugging from the START node: Click “Test Run”, enter the mock input (if the input is complex, the input structure will be inferred automatically), and then click Confirm to execute your graph. The result of each node will be displayed below.
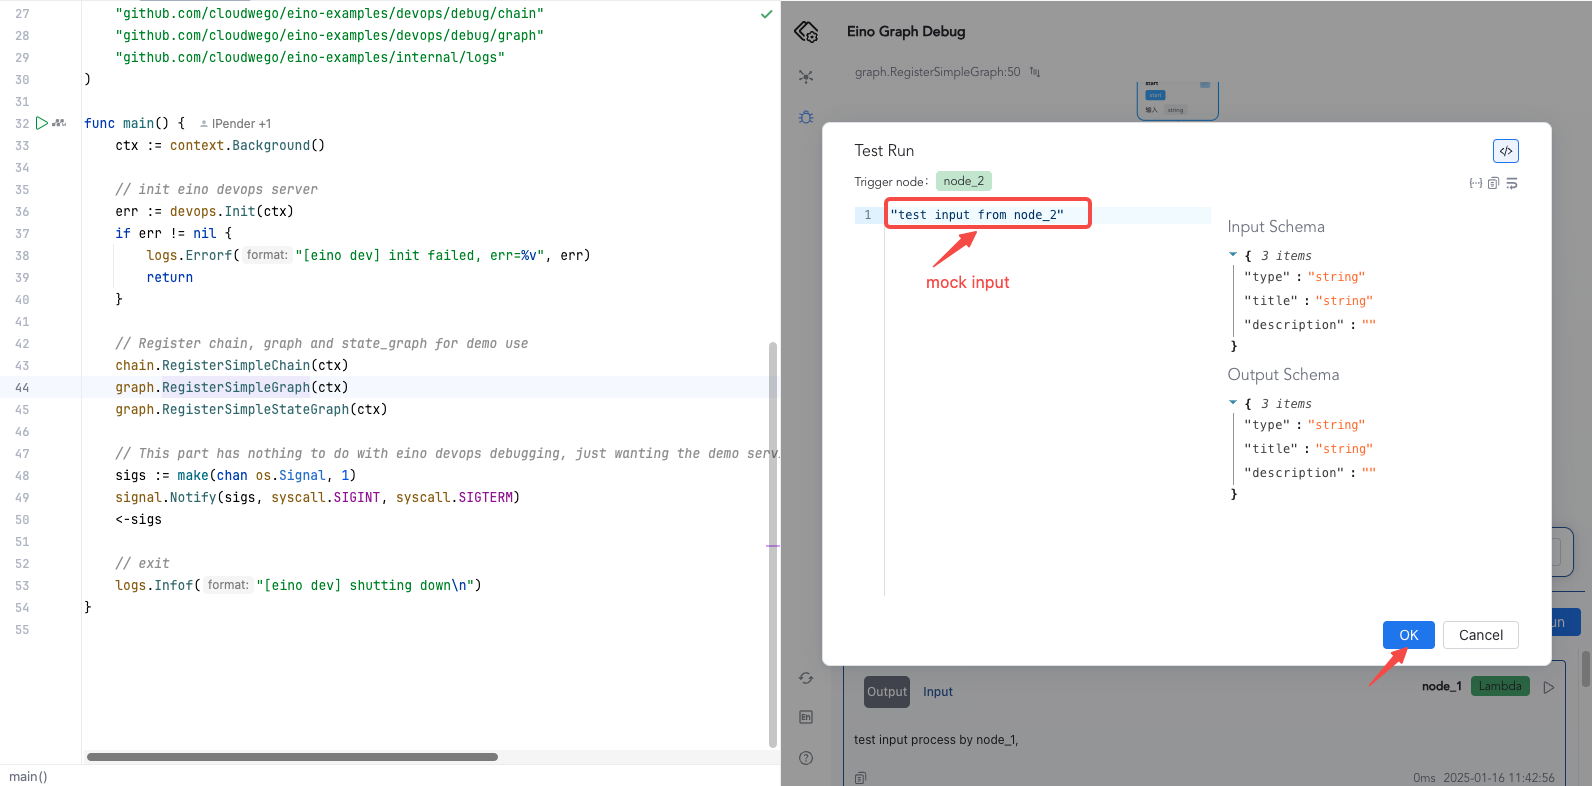
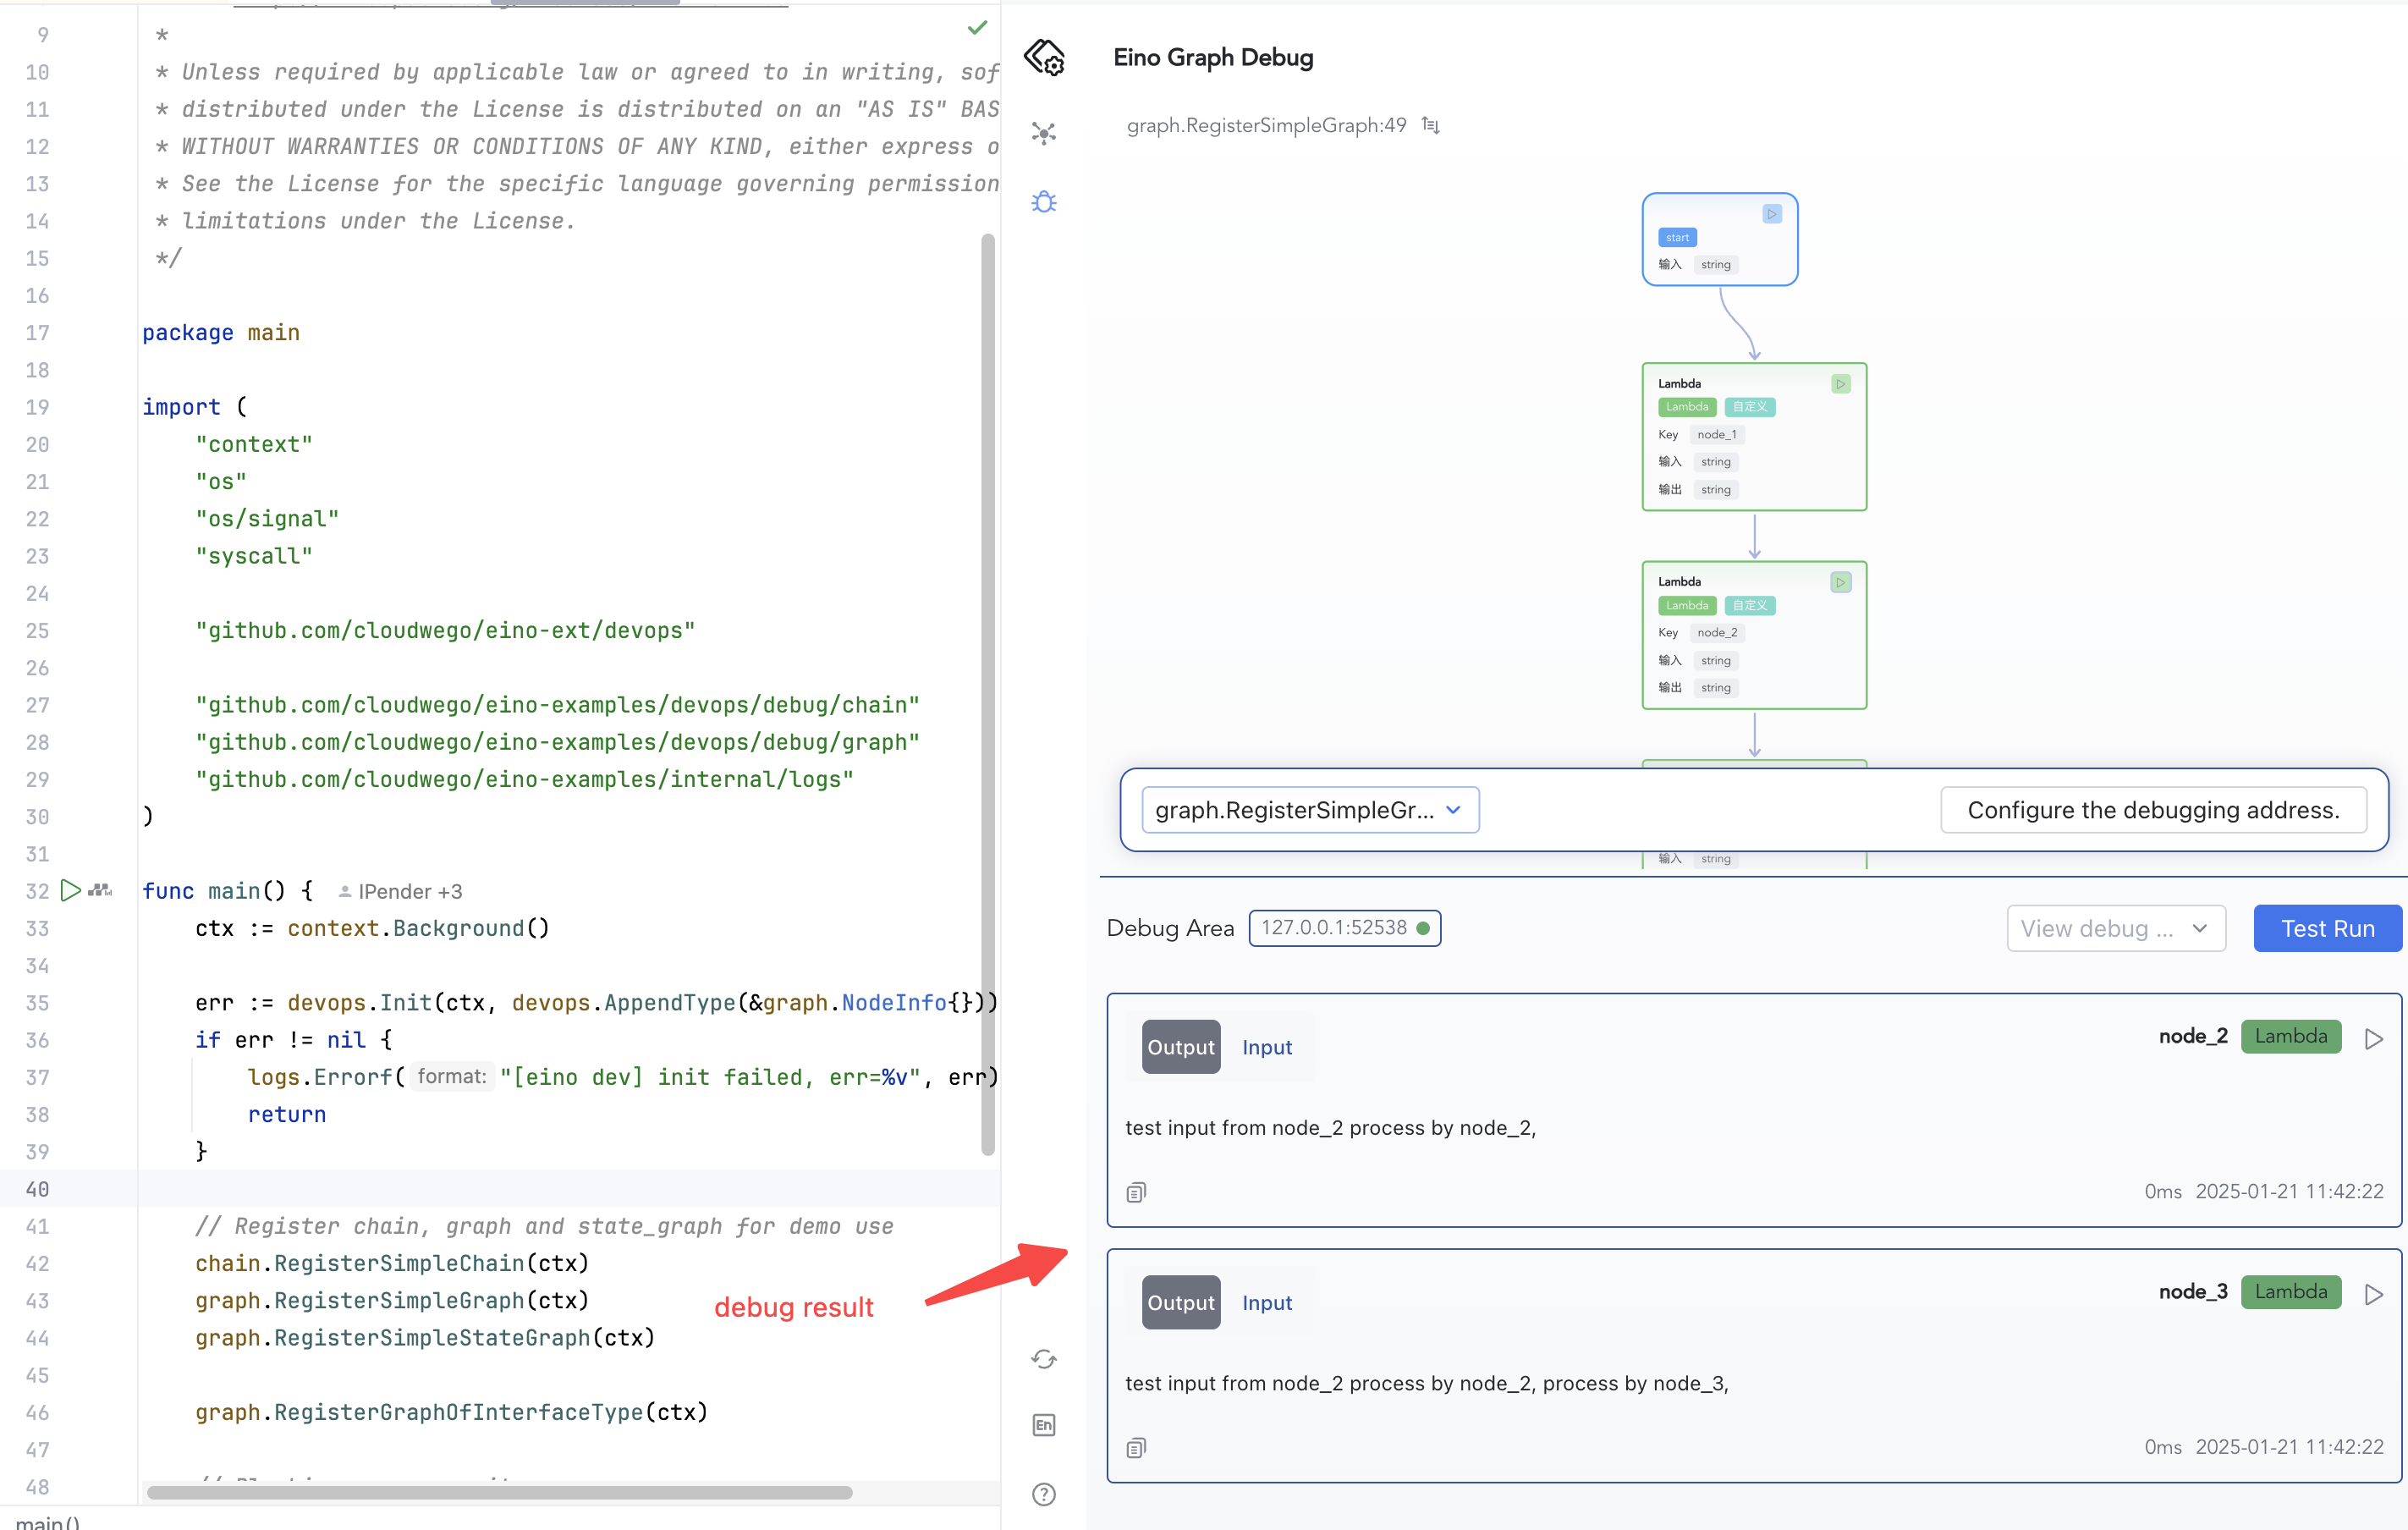
- Start debugging from any operable node: For example, execute starting from the second node.
View Execution Results
Start debugging from the START node, click Test Run, and view the debugging results below the plugin.
Debug from any operable node and view the debugging results below the plugin.
Advanced Features
Specifying Implementation Types for Interface Fields
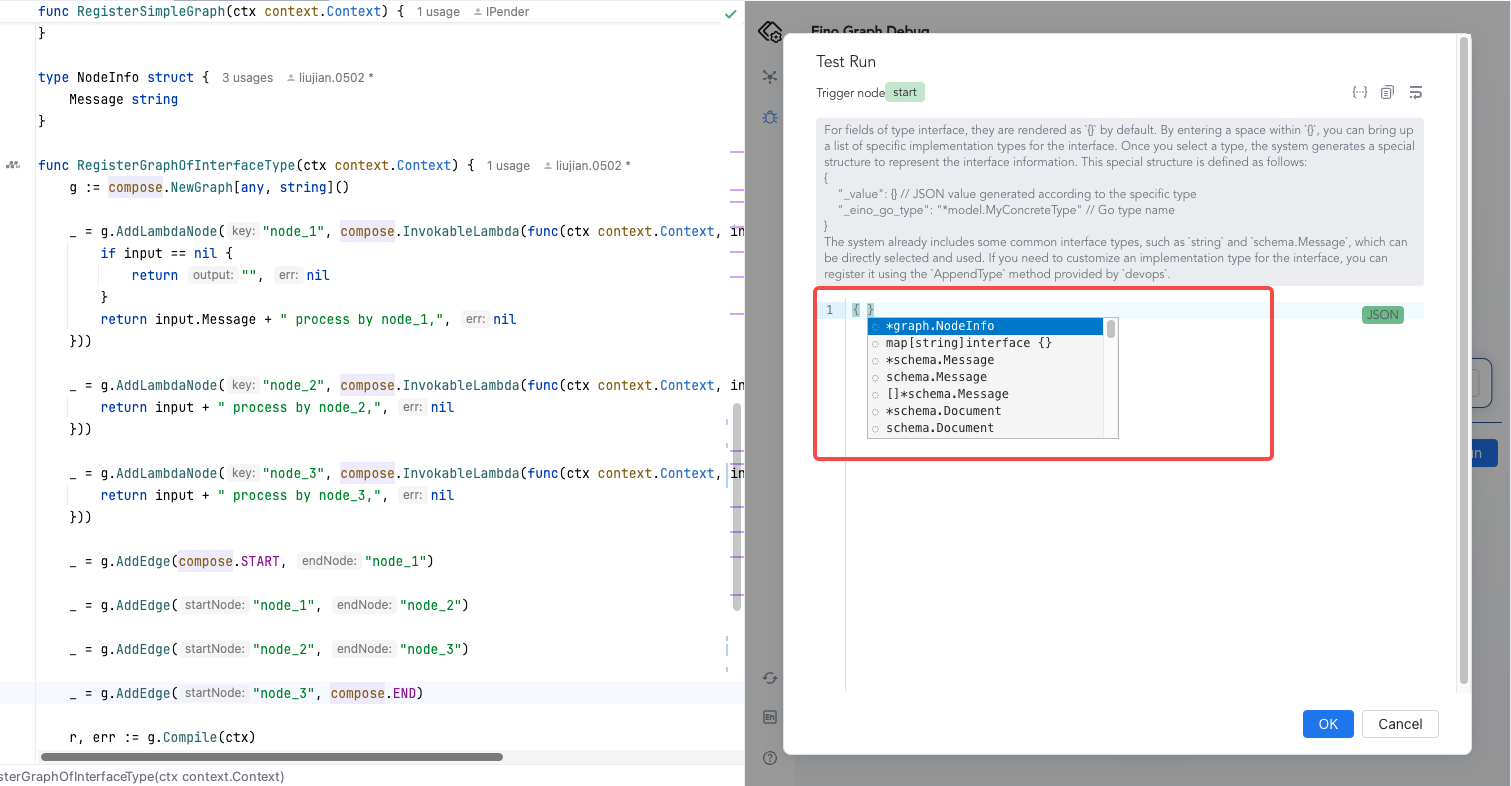
For fields of the interface type, they are rendered as {} by default. By entering a space within {}, a list of interface implementation types will appear. After selecting a type, the system will generate a special structure to represent the interface information; this special structure is defined as follows:
{
    "_value": {} // JSON value generated according to the specific type
    "_eino_go_type": "*model.MyConcreteType" // Go type name
}
💡 The system has some common interface types built-in, such as
string,schema.Message, etc., which can be used directly. If you need to customize the interface implementation type, you can register it using theAppendTypemethod provided bydevops.
-
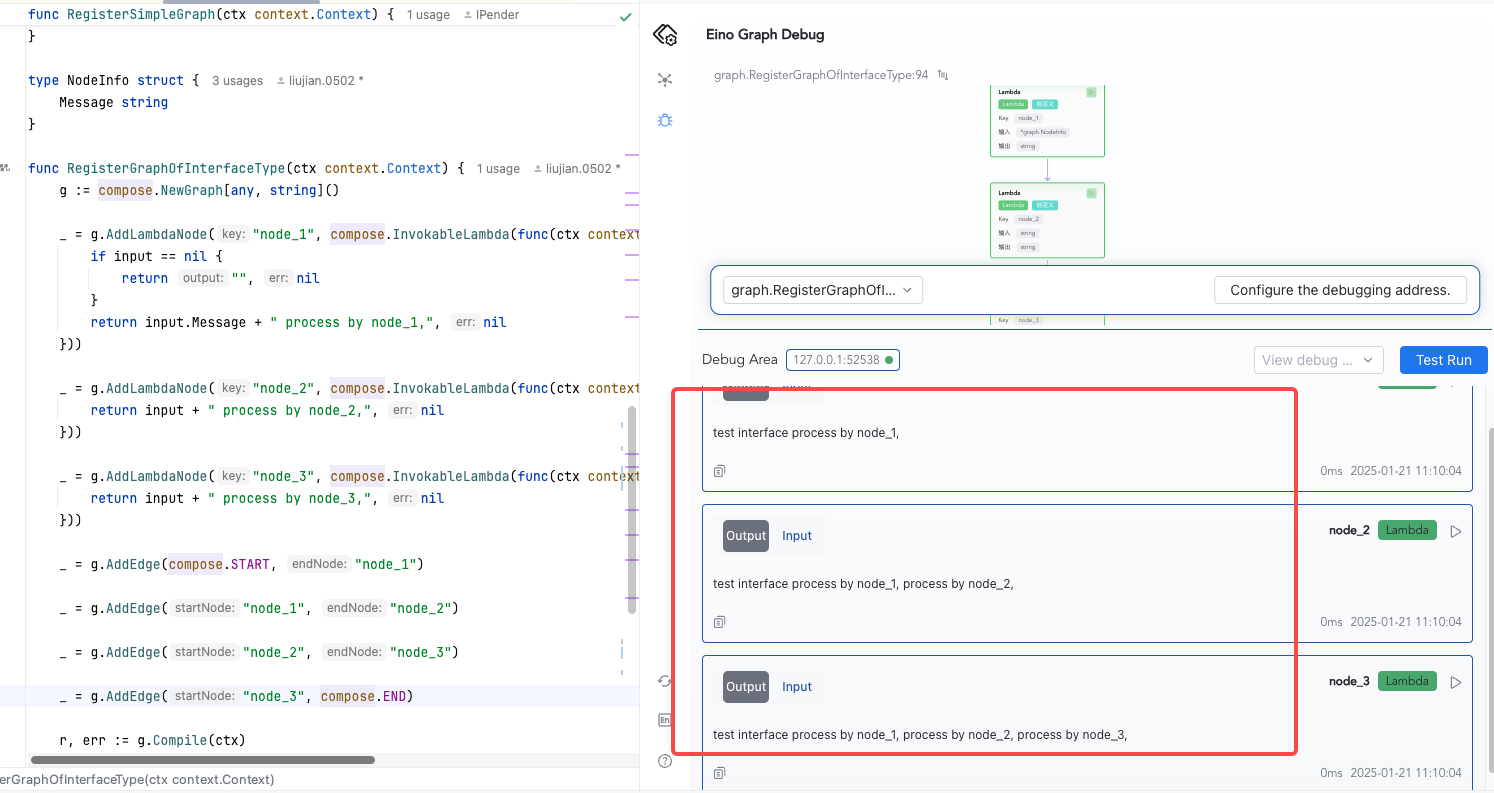
Suppose you already have the following orchestration code, where the input of the graph is defined as
any, and the input ofnode_1is defined as*NodeInfo:type NodeInfo struct { Message string } func RegisterGraphOfInterfaceType(ctx context.Context) { // Define a graph that input parameter is any. g := compose.NewGraph[any, string]() _ = g.AddLambdaNode("node_1", compose.InvokableLambda(func(ctx context.Context, input *NodeInfo) (output string, err error) { if input == nil { return "", nil } return input.Message + " process by node_1,", nil })) _ = g.AddLambdaNode("node_2", compose.InvokableLambda(func(ctx context.Context, input string) (output string, err error) { return input + " process by node_2,", nil })) _ = g.AddLambdaNode("node_3", compose.InvokableLambda(func(ctx context.Context, input string) (output string, err error) { return input + " process by node_3,", nil })) _ = g.AddEdge(compose._START_, "node_1") _ = g.AddEdge("node_1", "node_2") _ = g.AddEdge("node_2", "node_3") _ = g.AddEdge("node_3", compose._END_) r, err := g.Compile(ctx) if err != nil { logs.Errorf("compile graph failed, err=%v", err) return } } -
Before debugging, register the custom
*NodeInfotype by using theAppendTypemethod:err := devops.Init(ctx, devops.AppendType(&graph.NodeInfo{})) -
During debugging, in the Json input box of the Test Run, fields of the interface type will be presented as
{}by default. You can view all built-in and custom registered data types by typing a space within{}and selecting the specific implementation type of the interface.
- Complete the debug node input in the
_valuefield.
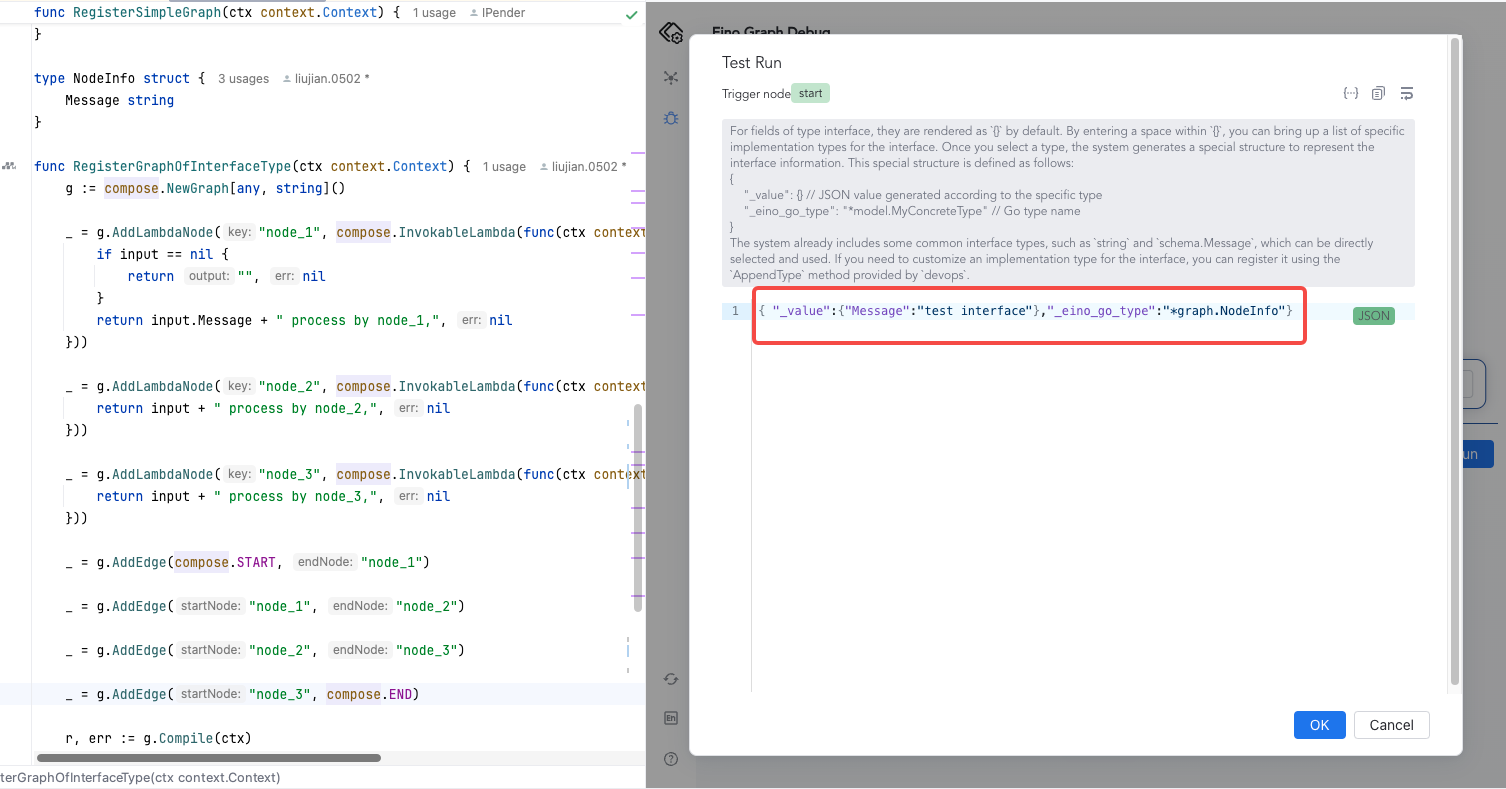
- Click confirm to view the debugging results.